Installer s Manual. DEQX- Cal Version 2.90
|
|
|
- Bruce Dennis
- 5 years ago
- Views:
Transcription

1 Installer s Manual DEQX- Cal Version 2.90
2 Table of Contents Copyright... 4 License... 4 Welcome to DEQX Calibration... 6 Features:... 7 How to use this manual... 8 Introduction... 9 Quick Start Installing DEQX Calibration Software Installing a Microphone Calibration file Correcting a Loudspeaker Calibration Wizard Verifying a Speaker Correction Configuring the DEQX unit Using the Parametric EQ Saving Equalizer Settings Measuring and Equalizing a Room Manual Room Equalization Incorporating a Subwoofer Reusing Existing Measurements, Corrections and Configurations How to Use / Modify an Existing Configuration How to Copy Parametric EQ Settings from the PDC to an Existing Configuration: How to View an Existing Room Measurement Upgrading the Firmware Project Concepts & Project Hierarchy The Speakers Folder The Calibration Templates Folder The Room Measurements Folder The PDC Configurations Folder Naming Conventions File Types Working with Projects
3 Viewer Wizard Speaker Measurement Setup Physical Setup Other Setup Speaker Measurement Parameters Verifying a Speaker Correction Data Viewer, Parametric EQ and Calibration Chart Controls IO Manager Input Selection Output Selection The PDC Control Panel vs the PDC Configuration Window PDC Configuration Types PDC Configuration Parameters Main Filter Limit Filters Time Alignment Advanced Options Speaker Calibration Parameters File Import Wizard Setup Options Customization Reporting an Error Upgrading DEQX-Cal software Error Messages Glossary Trouble Shooting
4 Copyright Copyright 2012 DEQX Pty Ltd, Sydney, NSW, Australia ( DEQX ). DEQX-Cal is a trademark of DEQX Pty Ltd. All other product or brand names may be trademarks or registered trademarks of their respective owners Disclaimer and Limitation of Liability DEQX Pty Ltd assumes no responsibility for loss or damage resulting from the use of the PDC- 2.6/PDC-2.6P, HDP-Express, HDP-3, HDP-Express II, HDP-4 or DEQX Mate (DEQX unit). Please refer the license supplied with the DEQX Calibration software. Contact support@deqx.com for installation and operational support. We highly recommend using the DEQXpert on-line installation and/or training service. Safety Instructions Warning To prevent fire or shock hazard, do not expose the unit to rain or moisture. To avoid electrical shock, do not open the unit. No user-serviceable parts are inside. Please refer any servicing to qualified personnel. Caution: ALWAYS TURN THE DEQX UNIT AND ANY ASSOCIATED AUDIO EQUIPMENT OFF BEFORE CONNECTING OR DISCONNECTING AUDIO CABLES. ANY AUDIO EQUIPMENT REQUIRING GROUNDING MUST BE GROUNDED TO THE SAME POINT (CIRCUIT) AS THE DEQX UNIT. FAILURE TO OBSERVE THESE WARNINGS CAN RESULT IN DAMAGE TO THE DEQX UNIT AND OTHER AUDIO EQUIPMENT AND MAY NOT BE COVERED BY WARRANTY. Damage may result to your speaker drivers and other equipment if your audio system is connected incorrectly or if the DEQX unit is used incorrectly. Unless you are using the DEQXpert installation service, it is recommended that you read the quick installation guide and ideally this manual and the DEQX User s manual before configuring your hardware and refer to your speaker manufacturer's specifications to ensure correct connection. If you are in doubt as to the connection of your audio equipment please seek assistance from a professional audio installer or contact DEQX at support@deqx.com See the DEQX license disclaimer. DEQX Processor Installer s Manual This document relates to version 2.92 of the DEQX Calibration Software and version 65.0 & of the firmware. For the latest software, firmware and documentation check License This is a legal agreement ( Agreement ) between you (either an individual or an entity), the end user, and DEQX Pty Limited, Sydney, Australia. By installing, copying, or otherwise using the Product (as defined below), you agree to be bound by the terms of this Agreement. If you do not agree to the terms of this Agreement, do not install, copy, or use the product, and promptly return the disks and any accompanying items (including written materials and binders or other containers, if any) to DEQX Pty Limited. DEQX LICENSE AGREEMENT for one Copy of DEQX-Cal Acoustic Calibration Software and Firmware 2013 DEQX Pty Limited. All rights reserved 4
5 GRANT OF LICENSE. DEQX grants the Recipient a limited, nonexclusive, non-transferrable, royalty-free license to make and use the software accompanying this agreement ( Product ) to be installed on approved Windows platforms for Recipient's use with DEQX Acoustic Digital Correction Hardware only. All other rights are reserved to DEQX. Recipient shall not rent, lease, sell, sublicense, assign, or otherwise transfer the Product, any accompanying printed materials ( Documentation ), or a digital content created with the Product ( Filter coefficients ). Recipient may not reverse engineer or decompile the Product. DEQX and its suppliers shall retain title and all ownership rights to the product, and this Agreement shall not be construed in any manner as transferring any rights of ownership or license to the Product or to the features or information therein, except as specifically stated herein. TERM OF AGREEMENT. The term of this Agreement shall commence on the date you accept this Agreement and shall continue unless terminated by DEQX in writing at any time, with or without cause. In the event that DEQX terminates this agreement Recipient shall promptly return to DEQX, or certify destruction of, all full or partial copies of such product and related materials provided by DEQX. PRODUCT MAINTENANCE. DEQX is not obligated to provide maintenance or updates to Recipient for Product licensed under this Agreement. DISCLAIMER OF WARRANTY. DEQX-Cal software ( Product ) is deemed accepted by Recipient upon first use. The PRODUCT IS PROVIDED AS IS WITHOUT WARRANTY OF ANY KIND EXCEPT. TO THE MAXIMUM EXTENT PERMITTED BY APPLICABLE LAW, DEQX FURTHER DISCLAIMS ALL WARRANTIES, INCLUDING WITHOUT LIMITATION ANY IMPLIED WARRANTIES OF MERCHANTABILITY, FITNESS FOR A PARTICULAR PURPOSE AND NONINFRINGEMENT. THE ENTIRE RISK ARISING OUT OF THE USE OR PERFORMANCE OF THE PRODUCT AND DOCUMENTATION REMAINS WITH RECIPIENT. TO THE MAXIMUM EXTENT PERMITTED BY APPLICABLE LAW, IN NO EVENT SHALL DEQX OR ITS SUPPLIERS BE LIABLE FOR ANY CONSEQUENTIAL, INCIDENTAL, DIRECT, INDIRECT, SPECIAL, PUNITIVE, OR OTHER DAMAGES WHATSOEVER (INCLUDING, WITHOUT LIMITATION, DAMAGES FOR LOSS OF BUSINESS PROFITS, BUSINESS INTERRUPTION, LOSS OF BUSINESS INFORMATION, OR OTHER PECUNIARY LOSS) ARISING OUT OF THE USE OF OR INABILITY TO USE THE PRODUCT OR DOCUMENTATION, EVEN IF DEQX HAS BEEN ADVISED OF THE POSSIBILITY OF SUCH DAMAGES. GOVERNING LAW; ATTORNEYS FEES. The laws of the State of New South Wales, Australia shall govern this Agreement and Recipient further consents to jurisdiction by the state and Australian federal courts sitting in the State of New South Wales. If either DEQX or Recipient employs attorneys to enforce any rights arising out of or relating to this Agreement, the prevailing party shall be entitled to recover reasonable attorneys' fees. 5
6 Welcome to DEQX Calibration Compared to all other components in the audio recording, production, media and playback chain, the mechanical nature of loudspeakers makes them extraordinarily prone to errors and distortion that detract from realism. These include timing (phase errors) where numerous groups of frequencies lag behind others to varying degrees. Related to these are amplitude (volume) errors that cause an inaccurate tonal balance that sound less real. These linear-errors : Group-delay (phase-response) errors and Frequency-response errors, are described by the measured Impulse Response of the speaker. DEQX compensates the signal driving the loudspeakers prior to amplification, so the speaker more closely resembles the original source signal. EQ, or equalization, has previously been applied to loudspeakers to correct their tonal balance (frequency response), but the phase delays added by traditional EQ are often significant enough to reduce timing coherence and hence realism. The crossover filters used to quarantine frequencies to their respective speaker drivers (transducers) exasperate these timing errors unless they have linear-phase performance, which is not possible using the steep analogue filters required to provide good isolation between drivers. DEQX compensates for frequency-response errors in fine detail based on measured errors. Traditional analogue or DSP based attempts to correct frequency-response tends to be broad brush, and introduce more timing and phase errors, which is why audiophiles often avoid using EQ. DEQX uses linear-phase EQ that not only does not introduce more timing/phase errors when correcting frequency response, but it compensates for existing measured timing/phase errors for hundreds of frequency groups by introducing a small window of time - in the order of just about 10 to 15 milliseconds so that the audio will not loose synchronization with video if used to allow the late frequencies can catch up. Going active : In addition to correcting Impulse-response errors, some DEQX units (PDC, HDP, and Express series) offer new generation active crossovers that provide steep linear-phase filters. DEQX units also measure and correct room related acoustic problems, and those supplied with remote controls provide 3-band user definable tone controls including one fully parametric band. Detailed tone controls can be user-defined and saved to 99 presets. In summary, using DEQX Calibrated EQualization, the measured erroneous characteristics of a particular loudspeaker, or generic model of a loudspeaker, are measured and corrected without room reflections corrupting the measurement. When combined with DEQX Calibrated active crossovers, each speaker driver can be better quarantined to operate within its more optimal linear (low-distortion) operating region, resulting in improved resolution and accuracy and often more natural sound dispersion in to the room. Once the native (anechoic) performance of the speaker is maximized, room acoustic problems are usually less problematic, but can be measured and compensated in combination with pre-set personal preferences. We highly recommend the use of the DEQXpert installation and training service. deqxpert@deqx.com for more information. 6
7 Features: Correcting full range passive (traditional Hi-Fi) speakers plus room correction: Anechoic Frequency-response calibration Anechoic Phase-response/Timing-coherence calibration Integrate subwoofer/s with time-domain and/or Parametric EQ room correction Multiband Parametric EQ for real-time preference and room EQ adjustment Improved imaging and sound-staging Improved frequency-response accuracy Improved timing coherence Three band tone control including a fully parametric-eq band with 99-memory (remote control) Additional features if using DEQX-Active crossover option (available on some models): Stereo 3-way active crossovers: 6dB/octave to 300dB/octave Steep linear-phase filter option Automatic timing/phase alignment between up to 3-way speakers (or 2-way plus subs) Increased loudness High dynamic resolution (reduced distortion) due to drivers operating in linear operating zone Reduced crossover distortion - reduced comb filtering Improved natural dispersion - reduced unwanted on-axis driver beaming of high frequencies 7
8 How to use this manual This manual is separated into three main sections: Using DEQX Calibrated - Step by step: A good starting point walks you through common procedures. Using DEQX Calibrated - Reference: Provides a more detailed description of parameters and processes. Finally, the Appendices provide additional information, such as a Glossary of Terms, and a comprehensive list of all Warnings and Error Messages. Throughout this manual, certain terms will be used with specific meanings: Choose: Choose a menu option. Menu options are separated by dashes e.g.: Choose File- Open: Open means click the File menu, then click the Open menu option. Choose is also used for clicking a tab in a tabbed dialog. Menu options can also be chosen with the selected with the navigation keys and activated with the Enter key. Select: Select an option in a list box or combo box. Click: Left click with the mouse on a button or icon. Buttons and icons may also be selected using the navigation keys and activated with the Enter key. Enter: Type text in a text box then move the focus from the text box to confirm the entry. It may not be appropriate to press the Enter key, as this may activate a selected command button. Instead you can move the focus by pressing the Tab key or clicking another control on the dialog. Menu options and available selections are displayed in bold. 8
9 Introduction DEQX units process the audio signal prior to power amplification so that the frequency and phase-response is corrected, while optionally incorporating linear-phase active crossovers into the correction filters. This process involves three steps: Measurement Correction Configuration The DEQX unit is linked via USB to a PC or Windows based Mac running the DEQX-Cal application. Using a calibrated microphone each speaker is measured and the DEQX-Cal software analyzes its Impulse-response, which provides its frequency-response (amplitude at all frequencies) and Phase-response (timing coherence across all frequencies, or Group Delay ). DEQX-Cal then provides the required time and frequency domain correction filters for the speakers, which may optionally include active crossover filters. Various combinations of Speaker-correction filters, Room-correction EQ and Preference EQ settings can be saved to four PROFILE memories in the DEQX unit, where they can be selected using the front panel buttons, the remote control or the PC running DEQX-Cal software. Installing and setting up a DEQX unit involves: *Connecting the DEQX unit to your system (see DEQX unit User Manual) *Installing and Launching DEQX-Cal software on a Windows PC or Mac PC running Windows *Connecting the DEQX unit via 5-metre USB cable provided to your PC or Mac running Windows *Choosing the configuration suitable for your sound system, such as passive speaker with optional subs, or 2-way active with subs, or 3-way active *Installing the DEQX-Calibrated microphone calibration file (optional) *Measure speakers (one speaker can provide a generic model correction) using the Measurement Wizard *Creating Correction Filters for speakers from their measurements using the Calibration Wizard *Configure the DEQX unit for your requirement: e.g. Passive speakers plus sub/s, OR 3-way active etc using the Configuration Wizard Skills necessary to operate DEQX-Cal software include basic Windows skills, such as launching applications, using menus and dialogs, and file management. These are not covered in this guide. This manual provides a reference for the software operation with hints relating to achieving the best results. 9
10 Quick Start After connecting the DEQX unit to your systems in accordance with the User Manual on the CD provided with your unit you are ready to get started! Connect your calibrated microphone to the DEQX unit and set it up to measure a speaker (see: speaker measurement set up on page 94. Launch DEQX Calibration, click the Measure Speakers icon. The measurement wizard guides you through the process of measurement. When measurement is complete: click the Calibrate Speakers icon, where the speaker measurement/s create the calibration filters. The Calibration wizard guides you through the process of analysis and correction. When analysis and correction is complete: click the Configure icon The Configure wizard sets up the DEQX unit to the configuration you are using. The options are: 1) A single amplifier driving each loudspeaker with optional mono or stereo subwoofers, or 2) An active 2-way speaker configuration (2 amplifiers per speaker) plus optional mono or stereo subwoofers, or 3) Stereo 3-way active (3 amplifiers) speakers. Once one of the above configurations is confirmed, the configure wizard guides you through the process of assigning filters to speakers and downloading the configuration to the DEQX unit. Installing and Launching DEQX Calibration Windows Software Minimum System Requirements The minimum system requirements for DEQX Calibration software are: PC or Mac* with Pentium-class processor, 1GHz or faster Microsoft Windows XP Home, Windows XP Pro, Windows 7 or Windows 8 installed 400 MB of free hard disk space 1GB RAM Minimum 800 x 600 pixel color display USB connector * Apple Mac computers or notebooks must run DEQX-Cal on Windows software (Windows XP, Windows 7 or Windows 8) via Boot Camp, Parallels version 7 or 8, or VMware. A minimum of 2GB of RAM is recommended if running Parallels or VMware. 10
11 Installing DEQX Calibration Software DEQX Calibration is installed with a standard Windows installation package. Insert the DEQX Calibration CD-ROM in your CD-ROM drive. If you have auto run enabled the software installs automatically. Alternatively you can run the file: setup.exe to start the installation. You will be prompted to supply the user details and installation directory. Launching DEQX Calibration Software: To launch, double click the DEQX Calibration icon on your desktop (if installed) or open the Windows Start Menu and choose DEQX Calibration from the DEQX Calibration menu. Connecting the DEQX unit to your PC or Mac with Windows: The DEQX unit is supplied with a 5-metre long USB cable to allow a notebook computer running DEQX-Cal to be adjusted from the listening position/s for comparing and saving to up to four listening preference profiles that can be selected using the remote control. To connect the DEQX unit to a PC or Mac for the first time: 1. Connect the DEQX unit to the PC using the USB cable. 2. Turn on the power switch on the rear panel. 3. Windows should automatically detect the DEQX unit and advise new USB hardware found. If the unit is not detected try turning the DEQX unit s mains power off and on again. The PC should recognize the new device. 4. Windows should start up a Found New Hardware or similar Wizard. This wizard may ask if Windows can connect to Windows Update to search for software. If so, choose 'No, not this time' then click Next. At the next dialog choose the option to install the software automatically. The Wizard should be able to find the driver by itself (you don't need to use the option of manually finding the driver). Windows may pop up a window to say that the software hasn't passed Windows logo testing. If this happens click on the Continue anyway button. 5. The Wizard will install the driver then ask you to click on Finish to close the Wizard. 6. Windows may pop up a brief message that new hardware has been installed. 7. Launch DEQX Cal. When the DEQX unit link to DEQX-Cal is successfully established, the link appears as follows: If the link is not established, the link icon appears with a negated symbol: Note using RS232: If USB is not available from your PC you can use the DEQX unit s RS232 connector instead. To change the connection type in the software from USB to RS232, choose Tools-Options. In the Configuration Options dialog choose the Configuration tab and select RS232. Choose Tools-Options. In the Configuration Options dialog choose the Configuration tab. Select the appropriate port name in the Port Name field. If you are not sure which COM port is appropriate, try each of them in turn 11

12 Selecting a serial port Verifying Your System Setup Immediately after connecting up your sound system, you should perform a preliminary configuration to verify your sound system wiring. DEQX units capable of 3-way active (PDC-2.6/P, HDP3, HDP4, Express and Express-II): The DEQX-Cal software automatically detects if your DEQX unit is capable of active 3-way set up, or is limited to single amplifier - for full range, usually passive, speakers - with optional subwoofer/s (e.g. DEQX MATE ). In the case of 3-way active capable DEQX units Profiles 2 and 3 are configured with crossovers, so if your system is a bi-amp setup (with or without sub-woofers), by selecting Profile 2 or 3 you can listen to your speakers to ensure that they are correctly connected. Otherwise load one of the DEQX configurations pre-installed in the default project (Project1), by following the steps below. 12
13 Configuration Crossover Between Main Speakers and Subwoofer(s) Crossovers in Main Speakers Single Amp with Mono Subwoofer 24 db/octave at 100 Hz None Single Amp with Stereo Subwoofers 24 db/octave at 100 Hz None Bi-amp None 96 db/octave at 2000 Hz Bi-amp with Mono Subwoofer Bi-amp with Stereo Subwoofers 24 db/octave at 100 Hz 96 db/octave at 2000 Hz 24 db/octave at 100 Hz 96 db/octave at 2000 Hz Tri-Amp None 48 db/octave at 500 Hz, 96 db/octave at 2000 Hz Open Default Project1. First select from the file menu open project. My Documents or Libraries and navigate to your documents folder and open the created DEQX folder and select Project1 file and select Open. Click on the Configure icon. This starts the DEQX Configuration Wizard. On the first window of the DEQX Configuration Wizard, click the Next button. In the second window of the DEQX Configuration Wizard, select the 'Load an existing DEQX configuration' radio button. This displays seven different pre-installed DEQX configurations. Apart from the Single Amp configuration, all the configurations have crossovers already created, between the main speakers and the subwoofer(s) and/or within the main speakers. Click on the configuration that best matches your speaker system, then click Finish. This will close the PDC Configuration Wizard and open the Configuration Window, showing your selected configuration a configuration selected, prior to clicking the Finish button 13

14 The default crossovers should be suitable for verifying your system setup. Of course the crossover frequencies and slopes can be adjusted to best suit the characteristics of your speaker drivers. Refer to DEQX Configuration Parameters in the reference section for details on how to adjust the crossovers. Click on the DEQX, in Profile 1. Save All to DEQX button to load the configuration into the Now you can listen to your speakers to ensure that they are correctly connected. The next step is to install a microphone calibration, then perform measurement and calibration on the groups of speakers in your system. Installing a Microphone Calibration file To install a microphone calibration, choose File-Install Microphone. Behringer microphones are available with a generic calibration file while Earthworks DEQX-Calibrated microphones are supplied with customised calibration files. In the Open dialog, browse for the microphone file name that corresponds to the serial number engraved on your microphone (Alternatively, in the File name text box, enter the microphone file name). ing DEQX with the serial number provides a microphone file, with a.mic extension. If the microphone calibration file cannot be found, it may be downloaded from or contact support@deqx.com 14
15 Measuring a Loudspeaker To perform this step you need a Measurement microphone, correctly configured and set up in the appropriate position relative to the speaker. A DEQX speaker measurement provides the speaker s native (anechoic) output before room acoustics add too (corrupt) the native instrument s output. This enables detailed timing correction to be applied, especially thru critical midrange frequencies, which isn t possible to achieve from room measurements. This is why DEQX room correction measurement and correction is only performed after speaker correction. DEQX-Cal provides multiple swept sine wave tones from which the speaker s Impulseresponse is derived to achieve a high resolution Impulse response measurement. The Impulseresponse describes a speaker s time and frequency domain behavior, showing which frequencies are louder or softer than they should be, and which frequencies have been delayed by driver mechanics, crossover filters and driver misalignment. From this information the Impulseresponse s correction is created based on settings that describe the frequency range to be corrected and the degree of correction required to provide most linear operating conditions for the speakers The Measurement Wizard guides you through the speaker measurement process. Choose Tools - Measure Speakers or click the Measure Speaker button The first window of the Measurement Wizard provides a brief introduction to the use of the wizard. Click Next to continue. 15
 and click Next.")
16 The second window gives you the option creating a new speaker measurement or loading an existing one. Select the 'Create a new speaker measurement' radio button (if it is not already selected) and click Next. t If for some reason the connection to the DEQX is not established at this point (because, for example, the DEQX is not connected and/or not switched on), you will get the above screen: 16

17 Establish / re-establish the connection to the DEQX. Check that the symbol appears above the volume slider, and then click Next. Choose the Speaker Manufacturer, Model and Configuration for which you are performing the measurement. You can also specify a name for the measurement, or accept the default. In the Distance, Angle and Height fields enter details of the way in which you have set up the microphone relative to the speaker. Once you have entered the appropriate data, click Next to continue. 17

18 When using an active configuration, the tweeter is driven directly by a power amplifier, so care must be taken not to damage it with inadvertent amplified clicks because it does not have a traditional passive crossover filter to protect it. The safest solution is to use a high quality film capacitor to block low frequencies and DC from damaging the tweeter. However, unless there is any DC voltage (e.g. loud clicks ) from the power amplifier this is usually not necessary because the DEQX-Cal software provides a High Pass filter for the swept frequencies used to measure the tweeter. The single pole (6dB/octave) high-pass filter defaults to 750Hz, sufficient to protect most tweeters intended to operate above say 2K-3K. Contact support@deqx.com if in doubt about the setting required for your tweeter. Select the minimum frequency to measure for each driver, then click Next to continue. 18


19 Specify a unique identifier for the speaker, then click Next to continue. The speaker's serial number is an appropriate choice as a unique identifier. In the DEQX configuration diagram, click on the speaker you are measuring, Left or Right then 19
 The measurement wizard then downloads to the DEQX the test signals determined by your selection (see the figure above) and plays them (see the figure below).")
20 click Next to continue. (This applies whether you are measuring a speaker for the first time or Verifying a Speaker Correction.) The measurement wizard then downloads to the DEQX the test signals determined by your selection (see the figure above) and plays them (see the figure below). The IO Manager will be automatically displayed when the test signal starts playing. (This applies whether you are measuring a speaker for the first time or Verifying a Speaker Correction.) 20
 or less from the speaker, we suggest a measured input level of between 80 and 90 db SPL.")
21 Use the IO Manager to select a microphone calibration file (if none is selected) and to adjust the Master Volume for optimum measurement. If you have the microphone around 3 feet (1 metre) or less from the speaker, we suggest a measured input level of between 80 and 90 db SPL. This may have to be adjusted depending on the gain of your amplifier and the efficiency of your speaker drivers. With speakers with smaller drivers, you may find it necessary to use a lower volume, because otherwise the bass driver may be driven to or near it's excursion limit at lower frequencies. This can result in a frequency-response that appears rolled off at the lower frequencies. Note: the measurement process ignores any other settings that can affect volume, including Gain Adjustment of the individual output channels. If for some reason you need to measure one driver of a speaker at a different volume than another driver of the same speaker, or if the drivers of a speaker has appreciably different efficiencies, then the Master Volume should be adjusted between the individual driver measurements (whilst the software is retrieving the data for and calculating the response for the previous driver). The software will warn if this occurs, but you can still accept the measurement. For Bi-amp or Tri-amp measurements, either or any of the drivers can be listened to in order to set the level (the default is the woofer). For example, in the figure below the woofer is selected, but the tweeter could be selected instead. This does not affect which driver(s) will be measured during the actual measurement process. For users with the Digital Output (HDP-4): If you are running the speaker measurements through the digital outputs, you must select the output to be digital - use the Output Selection drop-down box on the IO Manager. The measurement signal will be outputted at 96kHz. 21

22 Once the volume has been set to an appropriate level and the correct microphone has been selected, click Run to start the measurement process. Note - you will need to ensure that ambient noise is minimized before clicking Run. 22
23 The screen picture shows a completed Measurement Wizard dialog for the Run phase of a Bi- Amp speaker measurement. The confidence levels for individual drivers are given as each driver is measured, so if the confidence (see Confidence in the Glossary of Terms) for the first driver is too low (less than 20 db) you can halt the measurement, adjust the Master Volume, reduce ambient noise and/or increase the number of sweeps, then repeat the measurement. When measurement is complete without error, click Next. If there are problems, go back, adjust levels and wiring, and repeat the steps until Measurement completes successfully. (This applies whether you are measuring a speaker for the first time or Verifying a Speaker Correction.) 23
24 The next Wizard dialog gives you the option of accepting the measurement or retrying. (This applies whether you are measuring a speaker for the first time, verifying a Speaker Correction or Measuring a Room.) Once you accept the measurement, and you do not wish to run more measurements immediately, the final Measurement wizard dialog gives you the following options when you click Finish: Close the wizard normally - this closes the Measurement Wizard. Selecting Calibrate Measurement - this closes the Measurement Wizard and starts the Calibration Wizard. 24

25 The Calibration Wizard covers both analysis and correction phases. You can analyze speakers and correct them individually or analyze a group of speakers and correct them as a whole. The Calibration Wizard guides you through this process. For more information refer to Correcting a Loudspeaker below. The speaker correction can be verified after it has been generated. See Verifying a Speaker Correction on page 36. In order to simplify this process, do not move the speaker or microphone after you have measured the last speaker, because the correction verification process requires the speaker and microphone to be in the same positions as they were when the original speaker measurement took place. 25
26 Correcting a Loudspeaker Once a speaker measurement has been carried out, using the Measurement Wizard, a correction filter can be generated for the speaker, using the Calibration Wizard. The correction filter is designed to correct the following characteristics of the speaker: The speaker s change in gain or loudness over frequency (commonly known as its frequencyresponse) The speaker s change in phase over frequency (commonly known as phase-response or Group delay) Note - if a pair of speakers is corrected together, the correction set created will match the phaseresponse of the speakers, ensuring that the speakers are in phase when used. Consequently, if you are planning to correct a pair of speakers, you should measure both speakers before using the Calibration Wizard, then correct both speakers together. To carry out a speaker correction, click on the Calibrate Speakers icon in the software. This will start the Calibration Wizard. The first window of the Calibration Wizard provides a brief introduction to the use of the wizard. Click Next to continue. 26
 and click Next.")
27 The second window gives you the option creating a new speaker calibration or loading an existing one. Select the 'Create a new speaker calibration' radio button (if it is not already selected) and click Next. 27

28 Select the configuration of the measured speakers. Select the speaker configuration that corresponds to the speaker configuration that you used when measuring the speakers. For example, if you measured a speaker with a bi-amp configuration, then select bi-amp configuration in this dialog. Select the speaker measurements to be used for the speaker calibration. Note non- matching speakers should not be corrected together. For example, you should not attempt to correct a main speaker and a sub-woofer together. If you measured the main speaker with a single-amp, bi-amp or tri-amp configuration and the subwoofer with a subwoofer configuration then you will find that the software prevents you from correcting the main speaker and the subwoofer together. 28

29 Select Next to continue Provide a name for the calibration template or accept the default name. Click Next to continue. 29

30 Calibration Wizard Clicking Next opens a window initially showing the impulse-response of the speaker(s) as measured. This impulse-response is shown on the anechoic tab of the window. Unless you measured the speaker in an anechoic chamber, the impulse-response as measured will include room reflections. In order to remove these room reflections and thus provide a correction of the speaker by itself, it is necessary to window or truncate the impulse-response. To do this, move the right marker to just left of the first reflection, as per the figure below (the left marker is fixed at 0 milliseconds). In the figure below, the signal received directly from the speaker was received at about 5 milliseconds and the first reflection was received at about 9.8 milliseconds, or about 4.8 milliseconds after the start of the direct signal. By truncating the impulse-response at 9.7 milliseconds (as noted in the top right corner of the chart), only the signal received directly from the speaker will be included in the measurement used to create the speaker correction. Clicking and dragging moves the marker. Hint it may be easier to identify the first reflection if you zoom in on part of the window. Use the icon to zoom in. When the marker is moved the windowed response curves (on the Smoothed Measurements, Crossovers and Limits tabs) are automatically regenerated to reflect the new location of the marker. 30


31 In the figure above are the smoothed measurements corresponding to the windowed measurement. The truncation of the anechoic impulse-response necessarily causes smoothing of the windowed response. This smoothing increases at lower frequencies. The shorter the duration of the truncated signal, the greater the smoothing generated. This smoothing causes the correction at lower frequencies to be less accurate than if there were no truncation. Consequently it is important to maximize the time between the speaker s own signal and the time of the first reflection. If your configuration is bi-amp or tri-amp, there will be a Crossovers tab available. In this tab you can adjust the frequency and slope of the digital crossover between the different drivers. In the figure below is the crossover screen corresponding to the smoothed measurements in the figure above and the crossover selected in the Calibration Wizard. The frequency can be adjusted by clicking and dragging the marker that appears at the intersection of the crossovers. Clicking and dragging either can adjust the slope of the that appear at the bottom of the crossovers. markers 31

32 In the Limits tab the Full Range line and the Desired Response line are shown. The Full Range is the measured response of the whole speaker, incorporating digital crossovers if you have included these. The Desired Response is the theoretical calibrated response of the speaker, having regard to the effective frequency range of the correction and the boost and cut limits. The effective frequency range and the boost and cut limits can be adjusted. In the figure above the frequency range of the correction has been set from about 200Hz to 20kHz. Setting the correction limit for low frequencies: In the diagram above, notice that the bass frequencies roll off below about 200Hz, suggesting that this 2-way speaker will later be incorporated with Subwoofers. Notice also that the correction zone (within the blue box) only starts above 200Hz. As noted above, the time delay from the start of the impulse to the room s first reflection in this case was 4.8ms, which is the time it takes sound to travel about 5 feet (sound travels roughly one foot per millisecond). The longer the delay for the first room reflection to arrive relative to the time it takes for direct sound to reach the measurement microphone, the more bass information can be gleaned. A minimum target would be 3 milliseconds, which will limit measurement usefulness to frequencies above about 400Hz. Doubling this to 6 milliseconds for example, achieves an additional octave of bass resolution: down to about 200Hz, which is the lower correction limit used for this case. In this example, if you attempt to correct below 200Hz phase distortion will be introduced to the filter, which will make the resulting sound dull and flat - worse than the uncorrected speaker. Methods to maximise the effective delay before the first room reflection include: 1) Placing the microphone closer to the speaker baffle. For example, if the baffle-tomicrophone distance was originally 1M and the first reflection reaching the microphone occurred 3ms later than the speaker s direct sound, then by halving the baffle-tomicrophone distance to say 0.5M (keeping the microphone s height from the floor the same) this will increase the relative first reflection delay to 6ms, achieving one octave improved bass resolution - down to about 200Hz instead of 400Hz. 2) Absorbing the floor reflection: Alternately, if keeping the baffle-to-microphone distance at one metre but entirely absorbing the floor reflection with suitable absorption materials such as 1ft high mound of pillows and/or woolen bed coverings (on floor between the baffle and microphone) while ensuring that the next closest reflective surface (walls, ceiling or cabinet surface etc) is a minimum of 2 metres away to the microphone, then this should also achieve a 6ms delay. 3) Placing mic height at half room height: If the speaker can be lifted from the floor so that the tweeter/midrange driver mid point is on-axis to the microphone which is set at half room height, and where the nearest reflective surfaces are at least also half-room height distance away from the microphone, there is no advantage using absorption materials because the reflection from the floor and ceiling will arrive at the same time. This will typically not provide a 6ms delay, but usually in the order of 4 to 5 milliseconds. 32
33 Of course if both the closer baffle-to-microphone distance AND absorbing floor reflections can be achieved, then a 12ms delay would be possible before the first reflection needs to be truncated, providing accurate bass phase information down to around 100Hz. Why not measure very close to the speaker s baffle? As noted above, the closer the microphone is to the speaker driver/s baffle, the less will be the corruption from room reflections. For example, if the microphone is at least one metre away from the nearest reflective surface, but only a few inches away from a driver, there will be virtually no reflection heard by the microphone compared to the direct sound - an ideal measurement scenario since virtually no truncation will be required at all. This is how subwoofers, full-range or co-axial drivers can be measured for example. The down side of very close measurements is that the speaker baffle itself contributes reflections that can entirely cancel out some frequencies in its near field depending on its width. Measuring a passive speaker triangulation between multiple drivers will also confuse close measurements. Triangulation timing errors are not a problem if measuring active speakers i.e. if DEQX s linear-phase crossovers are bi-amping or tri-amping the speaker. This is because the stand-mounted measurement mic can be lifted and lowered to be on axis with each driver as it is being measured (it s an option to pause measurements between drivers to enable moving the mic height to be on-axis with each driver, and so to be located closer to each driver - say 30cm to 50cm). What s a good low frequency target for anechoic correction? We are psycho-acoustically less aware of phase errors at lower frequencies due to their long wavelengths, which interact with our listening room significantly. For example 200Hz has a wavelength of 1.7 metres (5.7 ft), if practical it is desirable to correct down to about 200Hz or below, implying a truncation target approaching about 6ms or more. As a general rule, DEQX correction strives to be anechoic above about 200Hz (upper bass) and include room reflections below that using DEQX s room correction, which uses minimum phase parametric Equalisation. However, where separate bass drivers can be driven independently by the DEQX unit e.g. main speakers plus subwoofer/s configuration, these can be corrected using separate left/right DEQX speaker measurements but measured from the listening position/s where no attempt is made to remove room reflections from the measurements, so that room reflections will also be processed in the time-domain, after which Para EQ can also be added if desired. As you can see there are several options regarding achieving the best measurements that depend on your loudspeakers (e.g. are they too big to be moved etc) and your listening room. DEQX can supply general advice regarding your circumstances through support@deqx.com, or for detailed assistance as well as software operation or full installation where we run the software for you, we highly recommend the use of our DEQXpert installation service. Note - the 'Sensitivity' column is not currently enabled. Once the crossovers and the limits have been set as desired, the correction set for the speaker (or speakers) is generated by clicking on the Finish button. More than one correction set can be generated if desired. A correction set will contain one or more correction filters one for each speaker that has been corrected. Ensuring Calibration Quality Follow these tips to ensure that you produce the best possible calibration. 1. Correct all the speakers that will be used at the same time (e.g. Left and Right) by ensuring they are all 'ticked' in the Calibration Wizard. This gives the best phase matching. 2. Experiment a little. Try using different crossover frequencies and see what gives the best 33

34 results. You can use the four different profiles on the DEQX for comparisons. The best starting point is to use the manufacturer's crossover frequencies. As a rule of thumb, do not cross-over to a tweeter at frequency lower than 2Khz in the case of a 1 tweeter, and 3.5kHz in the case of a ¾ tweeter. 3. Try varying the anechoic window cursor and the smoothing level to see how the frequencyresponse is affected. If there are anomalies in the response this is a good place to experiment. You can also disregard aspects of the measured response using the limits. You will soon get a feel for how these all work together. When you leave the Calibration Wizard (via the Finish button) it opens a window initially showing preset Group Correction Delay parameters that can be adjusted, or accept the default settings (refer to Speaker Calibration Parameters for more details). Either enter a name or accept the default for the correction set. Click Next to continue. 34

35 The above window displays the calibration information. Click Finish to create a calibration and Next to exit the Calibration wizard. 35
, one or both of the measurements can be verified.")
36 Once the calibration process is complete the results of the correction filter are displayed in a new tab at the bottom of the calibration wizard. Verifying a Speaker Correction Once a pair of speakers has been corrected (See Correcting a Loudspeaker), one or both of the measurements can be verified. To verify a speaker measurement, click on the Verify Results button. 36
37 We recommend that the last speaker to be measured be verified, so it will not be necessary to move the speaker or the microphone. The Verification Measurement Wizard will start. The Verification Measurement Wizard defaults to the settings that were used when the measurement was originally carried out. The first screen is an introduction to the verification wizard. Click Next to continue. 37

38 The first dialog lists the correction sets and, within those, the correction filters, that have been generated with the current calibration template. 38

39 Select the speaker that you wish to verify, then click Next. 39

40 Set the volume to an appropriate level to achieve a similar volume as measured by the microphone as was achieved when the speaker was originally measured, using the Master Volume control on the IO Manager. You may find that the Master Volume has to be set to a different level than was used when the speaker was originally measured because of cut or boost applied by the correction filter. Click Run to start the verification measurement. 40
41 Once the measurement is completed click Next. 41
 is too low (less than 20 db) you can adjust the Master Volume, reduce ambient noise and /")
42 The next Wizard dialog gives you the option of Accepting the measurement or Retrying. If the confidence (see Confidence in the Glossary of Terms) is too low (less than 20 db) you can adjust the Master Volume, reduce ambient noise and / or increase the number of sweeps, then repeat the measurement. 42
43 If you clicked Accept in the previous dialog, this final dialog will appear, with the verification measurement displayed behind it on the Data Viewer. Click Finish to close the dialog and the Verification Wizard. 43


44 A verification measurement displayed in the Data Viewer. Note that verification measurements are not stored. If you would like to print the graph for later use select print from the file menu. Click Sum to see the summed measurement. Configuring the DEQX unit Once a correction set has been created for a speaker (or pair of speakers), the DEQX must be configured. To carry out a configuration, click on the Configure icon in the software. This will start the DEQX Configuration Wizard. The Configuration Wizard will guide you through the initial configuration of the DEQX. 44

45 The first window of the Configuration Wizard provides a brief introduction to the use of the wizard. Click Next to continue. 45
 that best matches your speaker set up and the method you used to measure")
46 The second window gives you the option of creating a new configuration or loading an existing one. Select the 'Create a new DEQX configuration' button (if it is not already selected) and click Next. In the third dialog window of the wizard, enter a name for the configuration, and choose the type of configuration (or mode) that best matches your speaker set up and the method you used to measure the speakers. For example, if you have a pair of two-way speakers that you measured with a bi-amp configuration, choose Bi-amp with stereo subwoofers or Bi-amp with mono subwoofer (It doesn t matter that you don t have subwoofers - there will be no signal sent to the subwoofer output channel(s) (L1 and R1) unless you configure the DEQX to do so). Click Create to create the configuration. 46

47 This will take you to the last dialog window and open the Configuration Window behind the Configuration Wizard. The last dialog window of the wizard provides tips on how to complete the configuration. Click Finish to leave the Configuration Wizard. Click Finish to Create the configuration. Each configuration has 4 profiles, with default names as follows: Profile 0 Profile 1 Profile 2 Profile 3 The profiles can be renamed and each profile can be different. For example, you may have corrections of the same speakers with differing correction filters, and/or varying amounts of para EQ cut/boost in different profiles, and even timing delays. However for any one configuration, all four profiles must have the same mode (eg if you selected Tri-amp they will all be tri-amp). When a new configuration is created, the speakers in all profiles are initially disabled. The correction generated for a speaker using the Calibration Wizard can be placed in the configuration. For example, say you have generated a correction set for a left speaker and a right speaker and 47


48 you wish to configure Profile 3 to have that correction set. Method, 1. Double-click on the box for the left speaker this brings up the Left: Filter Properties box. 2. On the Main Filter tab, select Use a correction filter for this loudspeaker. 3. Select Calibration Templates, then the speaker name, the Correction Set you generated, then the speaker that you have set up in the left position. (Refer to the figure below) 4. Click OK. 5. Double-click on the box for the right speaker and repeat steps 1 to 4 above for that speaker. 48
49 Each filter can be further adjusted by using low pass and / or high pass filters and time alignment. This can be useful when using a full range speaker in conjunction with a subwoofer. For further details see DEQX Configuration Parameters. Once the profiles have been configured they can be loaded into the DEQX by clicking on the Save All To DEQX button. Note - when the Save All to DEQX button is clicked, all four profiles from the open configuration are saved to the DEQX. Since all profiles of a new configuration are disabled until you change them, if you install a correction filter in just one profile of a new configuration, then save it to the DEQX, the other profiles of the DEQX will be disabled, irrespective of what those profiles may have been before. Note that the DEQX Configurations saved to the DEQX unit have been generated in 'non-real time' i.e. they only affect the processing by the DEQX unit once the Save All to DEQX button is clicked. This contrasts to changes made in the DEQX Control Panel, which affect the processing on the DEQX in real time i.e. any change made in the DEQX Control Panel instantaneously affects the DEQX. For more on this subject see IO Manager in the Reference section. To save a DEQX Configuration on your PC (not on the DEQX), click on the Save button once you have set up the DEQX Configuration. This also saves the measurement(s) and correction(s) you have created. Finding Out What is Configured on the DEQX The DEQX Configuration and Equalization on the DEQX unit are reflected on the DEQX Control Panel in real time. This means, for example, that if you disconnect one DEQX from the PC and connect another DEQX to the PC, the DEQX Control Panel will automatically update to reflect the configuration and equalization on the new DEQX unit. The Filters in the DEQX unit are shown on the DEQX Control Panel when the Download button is clicked. In summary, the IO Manager tab, Equalizer tab and Configuration tab are updated automatically whilst only the Filters tab needs to be updated manually. Note that the Configuration tab and Filters tab of the DEQX Control Panel are information windows only - you cannot, for example, create a new configuration or modify an existing configuration from the Configuration tab of the DEQX Control Panel. To do this, use the Configuration tab of the Configuration Window. Using the Parametric EQ The parametric equalizer can be used to compensate for peaks or troughs in the measured response of the room. It can also be used to compensate for frequency imbalance in certain recordings, or to tailor a system to a user s personal preferences (for example, a brighter high end). To display the Parametric Equalizer, click on the DEQX Control Panel icon, and then click on the 49
50 Equalizer tab at the bottom of the DEQX Control Panel. Changes made to the Parametric Equalizer take effect in real-time. To add an EQ band to the equalizer, click on the Add Point button on the tool bar at the top of the screen, then click on the EQ curve at the desired frequency of the EQ band. The cursor changes to cross hairs, where the center frequency and bandwidth may be adjusted by clicking and dragging the relevant point. Up to 10 bands of equalization may be applied (or up to 7 bands, if you're using the EQ controls on the remote control supplied with the DEQX). The center frequency, gain (or cut) and width (Q) of each band may be set. These values can be set visually using the mouse: To adjust the center frequency of an EQ band, drag the center-point of the band left or right To adjust the amount of gain of an EQ band, drag the center-point of the band up or down To adjust the width of an EQ band, drag either end point of the band left or right 50
51 Close-up of an EQ band, showing the center-point and the left and right end points The three values of an EQ band (i.e. frequency, gain and width) can also be set numerically by clicking on the EQ band in question then right-clicking (or by double-clicking on the band), clicking on Properties then entering the appropriate values. The Invert EQ button is intended to be used if you're setting parametric EQ points manually (not in conjunction with the Autoset EQ button, which is explained in the section Automated Room Correction Using Autoset EQ). The idea is to add all the points you want (up to 10, or 7 if you're using the EQ controls on the remote control) to get your parametric curve to match the room measurement curve(s) as closely as possible, then use Invert EQ to invert all your points, thus resulting in a curve that cancels out the room measurement peaks and troughs. Saving Equalizer Settings Parametric Equalizer settings may be loaded into a PDC configuration, from the PDC, by clicking on the Read EQ from PDC button on the tool bar at the top of the configuration screen. Once the EQ settings have been loaded into a PDC configuration they will be saved in the project when the Save icon is clicked. In other words, although the EQ settings are changed in the Equalizer tab of the PDC Control Panel and instantaneously take effect in the PDC and are saved there without any further action, they are not saved on the PC until they have been read from the PDC into a PDC configuration. For details of the other controls of the Parametric Equalizer refer to DEQX Viewer and Response Charts. Measuring and Equalizing a Room Once a configuration has been set up in the PDC and the speakers are placed in their intended final locations, the speakers can be measured with the microphone in the listening position, in order to measure room effects. To launch the Room Measurement Wizard click on the Measure Room icon on the tool bar. The first window of the Room Measurement Wizard provides a brief introduction to the use of the wizard. Click Next to continue. 51

52 Alternatively, if you have more than one project loaded (Refer to Projects in the Reference section), the first window will prompt you to supply the name of the project in which the measurement will be stored. 52
53 You can accept the default project or select another project from the drop-down box, then click Next to continue. 53
 and click Next. Enter the required measurement parameters.")
54 The second window gives you the option creating a new room measurement or loading an existing one. Select the 'Create a new room measurement' radio button (if it is not already selected) and click Next. Enter the required measurement parameters. All drivers in a speaker may be measured concurrently. Measuring drivers separately may help to isolate response or room characteristics associated with a particular driver. Click Next to continue. 54


55 Select the speakers you wish to measure. Each speaker will be measured in turn. Click Next to continue. Each room may be measured in several locations. Click Run to continue. 55
 peaks at about 90 db. Some experimentation may be required for best results.")
56 The PDC will be initialised. This will take a few seconds. Then test signal will be played. The IO Manager will be opened automatically, so that you can set the Master Volume to an appropriate level. We suggest that it be set so that input level (as measured by the microphone) peaks at about 90 db. Some experimentation may be required for best results. Select the microphone as required, using the lower of the two drop down boxes for Input Selection. Click Run to continue. 56

57 Note - during a room measurement, not only is the Master Volume level taken into account, but so is; * The filter in the current profile, including the speaker correction filter(s) and any crossover between a speaker filter and a subwoofer filter * All settings in the IO Manager, including individual channel gain and any channel soloing, muting, or polarity settings. The parametric EQ and the EQ applied from the remote control are NOT taken into account during a room measurement. Once the measurement is completed satisfactorily click the Next button. 57

58 If the measurement was successful click the Next button. Otherwise click Retry, repeating the measurement with more sweeps, lower ambient noise or adjusted volume level. 58

59 If you have finished taking measurements, click the Finish button. By default the Parametric Equalizer will be opened, with the room measurements loaded so the results can be seen. A room measurement loaded in the Parametric Equalizer window Using Parametric EQ to Equalize a Room By default, the room measurement is smoothed by 100% as the high resolution room effects are often very position dependant. The smoothing level can be changed by using the Smoothing slider at the top of the equalizer. Also by default, the room measurements are normalized to a 0 db level. You can adjust these levels by changing them in the legend at the bottom of the Equalizer. See Using the Parametric EQ for more details on its use. Tip when applying manual or automatic EQ: The Sum button can sum the individual components of a room measurement (ie the left and right speakers, the left and right subwoofers) to give an overall room response. However, please note that it sums the responses, it does not average them (for example, a 10dB peak in both the left and right speakers will be a 16dB peak on the summed response, because doubling the speakers adds 6dB). This means that you should not sum the room measurements then try to set equalization to correct that sum, because the EQ will overcompensate for the room measurement. Instead you should apply EQ using the individual, un-summed room measurements, only using the summed response as a guide. 59
60 Manual Room Equalization To add an EQ Band to counteract a peak or trough in a room measurement, first click on the Add Point button on the tool bar at the top of the screen. For instructions on how to move and shape an EQ band, refer to Using the Parametric EQ. One way to add EQ that counteracts the room effects shown by a room measurement is to firstly add EQ bands (up to 10, or 7 if you're using the EQ controls on the optional remote control) so that the overall EQ line approximately duplicates the line of the room measurement. Secondly, once you've added all the EQ bands, click on the Invert EQ button to invert the EQ line, thus producing an EQ line that cancels out the room measurement. 60
61 Part of the room measurements for left and right speakers, prior to the addition of any parametric EQ 61
62 One band of parametric EQ applied to the room measurements, duplicating the line of the room measurements. 62

63 Several bands of Parametric EQ applied to the room measurements The Parametric EQ bands inverted using the Invert Button, in order to cancel out the peaks and troughs of the room measurements You can of course also apply the EQ bands without using the Invert EQ button, by adding EQ bands that have gain which is the opposite of that of the room effects. 63
 or automatically (by Autoset EQ as described below).")
64 A single EQ Band applied to correct a trough in a room measurement Notes: The Invert EQ button will invert the whole of the EQ line, irrespective of whether the EQ bands were generated manually (by you) or automatically (by Autoset EQ as described below). Thus, if you plan to do some manual room equalization, making use of the Invert EQ feature, as well as using the Autoset EQ button for the lower frequencies, make sure to do the manual room equalization before using the Autoset EQ button. Otherwise, if you use the Invert EQ feature after using the Autoset EQ, the automatically generated EQ bands, which were already inverted by Autoset EQ, will be inverted again and will add to the room effects rather than cancelling them out. 64

65 Sharp spikes in a room measurement are generally less audible than broad peaks and thus as a rule do not require correction as much. If you need to choose between correcting a broad peak and a sharp spike, the priority would normally be to correct the broader peak. Automated Room Equalization Using Autoset EQ To apply an automated equalization of the room measurement, first make sure that the room measurements are smoothed to 100%. Click the Autoset EQ button (above the frequency-response chart, on the left). Default settings for the Autoset EQ options The parameters can be adjusted to suit the nature of the particular room measurement if desired. The EQ style can be parametric (in which the width, frequency and magnitude of the boost / cut bands will be varied individually) or graphic (in which the number of bands is distributed evenly over the specified frequency range and only the boost / cut of the bands will be varied individually). Note that 7 bands are available if the remote control is used as a 3-band tone control. If not ten bands are available. Click OK to set the parametric EQ points to attenuate the peaks and troughs of the room measurement. 65

66 A room measurement with automated EQ set, using the default settings Notes: The Autoset EQ defaults to minimal disturbance by introducing only narrow bandwidth filters at the frequencies with relatively subtle amplitude correction where maximum deviation occurs. It is recommended to make manual manipulations of Autoset levels and bandwidths as music is playing in order to achieve personal preferences. If extra profiles available, they can be used to store several versions of EQ. When you correct a room measurement or measurements using the Autoset EQ function, it actually uses exactly what you see, it doesn't go behind the visible shape of the room measurement plot(s) to the 'original' room measurements. This means, for example, that the Autoset EQ will provide a different correction if you don't smooth the measurements, compared to the one it would provide if you do. The automated EQ will only be applied at frequencies where all relevant room measurements (not just one) need correction. The AutosetEQ will only correct at a frequency if all measurements require the same sign of correction at that frequency. For example, if left and right measurements are both above 0 db at a particular frequency, AutosetEQ will attempt to cut at that frequency. However, if left is below 0 db and right is above 0 db at a particular frequency, AutosetEQ will do nothing at that frequency 66
67 Incorporating a Subwoofer There are a number of different ways to incorporate a subwoofer. However, one method is as follows: 1. Measure and Correct your speakers (see Measuring a Loudspeaker and Correcting a Loudspeaker). When correcting the speakers, window in order to eliminate the first reflection. This will typically make the speaker correction less than ideally accurate below about 150 Hz, but the intention is that the subwoofer(s) will be taking over below that frequency, so the low frequency performance of the main speakers is not so important. 2. Measure and Correct your subwoofer(s) (again, see Measuring a Loudspeaker and Correcting a Loudspeaker). Measure the subwoofer(s) at 15cm this provides essentially anechoic measurements of the subwoofer. Alternately, each subwoofer s output can be measured INCLUDING room reflections (locate the sub at its intended room location), by measuring the subwoofer at the listening position sweet spot, or over a wider area by holding (still) then moving the microphone in between sweeps. Move the mic (quickly) between one or two sweeps, then move quickly to a new position, and so on. The number of sweeps can be set to say 16 to all quickly, sweep then move etc don't move continuously) while keeping the distance from the mic to the subwoofer as constant as possible. At subwoofer frequencies the wavelength is several metres long, allowing manual movement of the microphone. Measuring midrange drivers and tweeters however requires the microphone to be a consistently exact distance from the drivers. When correcting the subwoofer(s), window at about 20ms or more and use limits of 20 Hz and 300Hz and set smoothing to 100%, but experimenting down to zero smoothing can also provide good results in some rooms. 3. Connect up your system and set the speakers and subwoofer(s) in their intended final locations. 4. Configure the PDC to match your setup (see Configuring the PDC). Use low pass filter(s) for the subwoofer(s) and matching high pass filters for the main speakers. The crossover frequency should be set to 150 Hz or higher (depending on where the main speakers were windowed in step 1. If you were able to make measurements of your main speakers with a longer time to the first reflection, then a larger window can be used for correction and they will be more accurate lower down, allowing a lower crossover frequency.) 5. Measure your room, using the profile in which you configured the speakers and subwoofer(s) (see Measuring a Room). Measure at the listening position, measure the drivers concurrently. 6. Load the room measurements into the PDC Control Panel's Parametric EQ (Or the Viewer). Refer to DEQX Viewer and Response Charts in the Reference section, which explains how to move, sum and manipulate plots. You will need this knowledge to carry out the steps below. 7. Normalise the measurements to 0dB and smooth them to 100% if they are not already so smoothed. 8. If the left and right speaker measurements are not equal above 150 Hz (or your chosen crossover frequency), move one of them to get them as close as possible, by adjusting the figure in the 'Scale' column. This should only be necessary if your room is not symmetrical from left to right. 67

68 For example, in the figure above the right speaker has been moved up from 31.2 db to 31.7 db, in order to get the overall level of the measurement curves for the left and right speaker to be visually as close as possible. Note that in this step, you are not adjusting the actual level that you will hear. Instead, the purpose of moving one speaker measurement is to determine how much it needs to be moved to get the two measurements to line up, so that the gain in the IO Manager can be adjusted later by the same amount. In the example above, the right speaker was increased by ( = ) 0.5 db. 9. Sum all the measurements and smooth the sum to 100%. 10. Note how the level of the summed response below 150 Hz (or your chosen crossover frequency) compares to the level above that frequency. Move the subwoofer plot(s) up or down in order to match these two areas as closely as practical. (Remember that you can use the Parametric EQ later to reduce any remaining peaks or troughs in the overall response). For example, you may have to increase the subwoofer(s) by 6 db. 11. Generate a new sum to show the effect of the change to the subwoofer(s). Remember that to do this you will have to hide the current sum and show the room measurements before summing, because the sum function works on the visible plots. 12. If the resulting sum is now as desired, go to the IO Manager (Refer to IO Manager in the Reference section). Otherwise return to step
69 13. In the IO Manager, use the gain adjustment for the individual channels to input the gain or cut that you determined in steps 7 to 12 above. For example, for the example given in step 8, increase the right speaker channel by 0.5 db (if it's bi-amped, increase both the right woofer (R2) and the right tweeter (R3) by 1.5 db). And for the example in step 10, increase the subwoofer(s) (L1 and R1) by 6 db. 14. Repeat steps 5 to 7 to check the adjustments made in step 13. If necessary, repeat steps 8 to 13. Reusing Existing Measurements, Corrections and Configurations The measurement, correction and configuration wizards can be used to access existing data, as well as creating new data. Using the Wizards, you can View an existing speaker measurement Use an existing speaker measurement in a new speaker calibration template Use / modify an existing speaker calibration template Use / modify an existing configuration Copy parametric EQ settings from the PDC to an existing configuration Access speaker calibration template(s) which were used in an existing configuration View an existing room measurement (Note - existing measurements, calibration templates and configurations can also be accessed using the Project Explorer. Refer to Using the Project Explorer in the Working with Projects chapter in the Reference section). How to View an Existing Speaker Measurement Click on the Speaker Measurement Icon. 69
, select the project that contains the existing measurement, then click Next.")
70 At the first window of the Speaker Measurement Wizard, just click Next, or, if you have more than one project loaded (as per the figure above), select the project that contains the existing measurement, then click Next. 70
71 At the second window of the Speaker Measurement Wizard, select the 'Load an existing speaker measurement' radio button. This displays existing speakers, sorted by manufacturer, model, serial number and measurement format (ie single amp, bi amp, tri amp or subwoofer). Click on the + sign for the desired speaker and measurement format. This will show the existing measurements for that speaker and measurement format combination. Select the desired measurement then click the Next button. The measurement can be displayed in either: 1. The Viewer (the New Viewer option in the drop-down box shown in the figure above) 2. The Equalizer tab of the PDC Control Panel 3. An existing Viewer window (the Viewer (1) option shown in the figure above) - ie one containing another measurement that you loaded into the Viewer previously. Select the window you wish to display the measurement and click the Finish button. 71

72 An existing measurement displayed in the Viewer window Alternatively, you can view an existing speaker measurement by going through the Viewer icon. Click the Viewer icon. This opens the Viewer Wizard. 72
73 At the first window of the Viewer Wizard, just click Next, or, if you have more than one project loaded (as per the figure above), select the project that contains the existing measurement, then click Next. 73
74 At the second window of the Viewer Wizard, select the 'Load old measurement or filters into a new viewer' radio button. Click on the + sign next to the Speakers folder, then click on the + sign next to the desired speaker / measurement format combination. This will show measurements and correction filters (if any) for that speaker / measurement format combination. Check the box next to the desired measurement, then click the Next button. 74
75 Similar to the third window of the Speaker Measurement Wizard, the measurement can be displayed in either: 1. The Viewer (the New Viewer option in the drop-down box shown in the figure above) 2. The Equalizer tab of the PDC Control Panel 3. An existing Viewer window (the Viewer (1) option shown in the figure above) - ie one containing another measurement that you loaded into the Viewer previously. Select the window you wish to display the measurement and click the Finish button. How to Use an Existing Speaker Measurement in a New Speaker Calibration Template Refer to Correcting a Loudspeaker. How to Use / Modify an Existing Speaker Calibration Template To modify an existing speaker calibration template, click on the Calibrate Speakers icon in the software. This will start the Calibration Wizard. 75
, select the project that contains the existing calibration template, then click Next.")
76 At the first window of the Calibration Wizard, just click Next, or, if you have more than one project loaded (as per the figure above), select the project that contains the existing calibration template, then click Next. 76
77 The second window gives you the option of creating a new speaker calibration template or loading an existing one. Select 'Load an existing speaker calibration' and click Next. This displays a list of the speaker calibration formats (ie single amp, bi amp, tri amp and subwoofer) used by existing speaker calibration templates. Click on the + sign next to the desired speaker calibration format. This will display a list of all speaker calibration templates with that format. Check the box next to the desired speaker calibration template, then click Finish. The Calibration Wizard will close and the selected speaker calibration template will be opened in a window, in the same way that a new calibration template is opened when correcting a speaker for the first time (see Correcting a Loudspeaker). Alternatively, and similar to speaker measurements, you can also view an existing speaker calibration template by going through the Viewer icon. How to Use / Modify an Existing Configuration Click on the Configure Icon. At the first window of the PDC Configuration Wizard, just click Next, or, if you have more than one project loaded, select the project that contains the existing configuration, then click Next. At the second window of the Configuration Wizard, select the 'Load an existing PDC configuration' radio button. This displays existing PDC configurations. Select the desired configuration then click the Finish button. How to Copy Parametric EQ Settings from the PDC to an Existing Configuration: This enables you to retrieve any equalization that has been created using the Equalizer on the PDC Control Panel onto an existing PDC Configuration. Open the existing configuration using the instructions for How to Use / Modify an Existing Configuration (see above). Click on the Read EQ from PDC button. When the PDC Configuration is saved to disk using the Save button, the equalization will also be saved. How to Access Speaker Calibration Template(s) that were used in an Existing Configuration Open the existing configuration using the instructions for How to Use / Modify an Existing Configuration (see above). The calibration templates used to create the filters in an existing PDC configuration can be accessed from the Configuration view by clicking on the Open Template button. If the configuration has been created from more than one template (ie if you have main speakers and subwoofers in the configuration) then you will be asked to select which template is required. 77

78 How to View an Existing Room Measurement This is similar to viewing an existing speaker measurement. Click on the Room Measurement Icon. 78
, select the project that contains the existing measurement, then click Next.")
79 At the first window of the Room Measurement Wizard, just click Next, or, if you have more than one project loaded (as per the figure above), select the project that contains the existing measurement, then click Next. 79
80 At the second window of the Room Measurement Wizard, select the 'Load an existing room measurement' radio button. This displays a list of rooms that have been measured and, within each room, a list of the existing room measurements. At this point you can either: 1. Select the desired room measurement by checking the box next to it, then clicking Next. This will select the room measurements of both / all the speakers in that room measurement. 2. Click on the + sign next to the desired room measurement to show both / all the speakers in that room measurement. You can then select one or more of the speakers by checking the box(es) next to it/them, then clicking Next. With the speakers shown, you can also still select both / all speakers in that room measurement by checking the box next to the room measurement, as for (1) above, then clicking Next. The measurement can be displayed in either: 1. The Viewer 2. The Equalizer tab of the PDC Control Panel (as selected in the figure above) 3. An existing Viewer window - ie one containing another measurement that you loaded into the Viewer previously. Select the window you wish to display the measurement and click the Finish button. 80

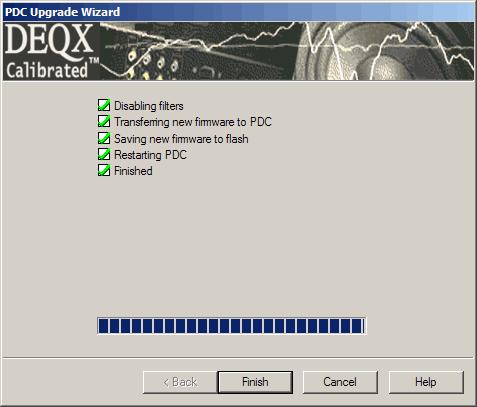
81 An existing room measurement displayed in the PDC Control Panel Equalizer window Alternatively, and similar to speaker measurements, you can also view an existing room measurement by going through the Viewer icon. Upgrading the Firmware To upgrade the firmware on the PDC, choose Tools-Upgrade PDC firmware from file. Click on the Upgrade button. When the upgrade is complete, click on the Finish button. 81

82 82

83 Project Concepts & Project Hierarchy In the course of performing calibrations with DEQX Calibration you work primarily with one type of file, the Project file. You cannot perform a calibration without a project file. A project file contains all the data for calibration of your sound system, i.e. speaker and room measurements, analysis design parameters, speaker and room correction filters. A project file is typically assigned to a single installation, for example a project file title could be My New Home. The project may contain calibration for more than one sound system which will be grouped in the project data hierarchy. The project layout is best described with reference to the Project Explorer. Refer to Using the Project Explorer in Working with Projects. There is always one project which will appear in bold text in the Project Explorer. This is the default project, the project where measurements and corrections will be placed. All of the wizards for measurement, analysis, and correction allow the default to be overridden at the wizard start page, provided there is more than one project loaded. A Project is a location for grouping related measurements, corrections and configurations. Each Project has an internal structure which can be shown in the Project Explorer. This structure may be likened to the structure of a computer drive, except with a pre-determined arrangement of folders and sub-folders. At the first sub-level, each project consists of Speakers, Calibration Templates, Room Measurements and PDC Configurations. The Speakers Folder The Speakers folder has sub-folders as shown below. 83

84 Within the Speakers folder can be one or more Speakers. Each one of these Speakers corresponds to a physical speaker plus the speaker configuration type, as per the example in the figure above. The fifth Speaker in the list above is a C&X brand speaker, model 916, serial number , in a single amp configuration. It can be seen from the figure above that a physical speaker can have more than one type of speaker configuration. There are four different speaker configurations: Tri amp, bi amp, single amp and subwoofer. This enables you to measure a speaker as (for example) both a single amped design, using the speaker s own crossover, and as a bi amped design, using the PDC s crossovers. Within each Speaker are a Corrections folder and a Measurements folder. Within the Measurements folder are the measurement(s) for that particular speaker / configuration pair. Within the Corrections folder are the correction(s) (if any) created from any one of the measurements in the Measurements folder. From the Project Explorer, within the Speakers folder, the measurements and corrections may be viewed by right-clicking on the individual measurements or corrections then choosing View. (Note: Many menus are accessible by right-clicking.) The measurements cannot be opened (in order to create new corrections) from within the Speakers folder. This can be done from the Calibration Templates folder. 84
.")
85 The Calibration Templates Folder The Calibration Templates folder has sub-folders as shown below. Directly within the Calibration Templates folder are the templates. A template contains one or more speakers (of the same configuration). The template contains the current correction parameters you have chosen (for an explanation of correction parameters, refer to Speaker Calibration Parameters). These correction parameters are saved when the project is saved, but doing so will not change the parameters used in existing corrections sets within that template. The parameters in a correction set remain unchanged unless the correction set is overwritten (refer to Correcting a Loudspeaker). A new template is generated each time you click on the Calibrate button or choose Tools - 85
86 Calibrate / Analyze Measurement (refer to Correcting a Loudspeaker). Within each template are two folders, one for the Measurements that have been used and one for the Correction Sets created. Within the Measurements folder are shortcuts to the speaker measurement(s) that have been used. Within the Correction Sets folder are the Correction Sets that have been generated using the Calibration Wizard. Within each Correction Set is a Corrections folder and within that folder are shortcuts to the corrections that have been generated, one correction for each measurement used. A correction set is a set of correction filters. These correction filters have been created with the same correction parameters. It may be seen that, ultimately, the Speakers folder and the Calibration Templates folder both provide access to the measurements and the corrections. However, the Speakers folder has a structure that reflects the way in which the speakers were measured, whereas the Calibration Templates folder has a structure that reflects the way in which groups of speakers were corrected. Within the Calibration Templates folder, an individual template can be opened by right-clicking on the template then choosing Open. Once the template is opened, new correction sets can be generated from the measurements previously selected for the template. The Room Measurements Folder The Room Measurements folder has sub-folders as shown below 86

87 Within the Room Measurements folder can be any number of room measurement folders. Each room measurement folder represents a room / audio system combination. Within each room measurements folder is a Measurement Positions folder. Within that folder are one or more measurement position folders, nominally representing different locations of the microphone. However, these folders can also be used to distinguish between measurements made with adjustments to the audio system, as per the example in the figure above. A new folder is created each time you click on the Measure Room button or choose Tools - Measure Room (refer to Measuring a Room). Within each measurement position folder is a Measurements folder. Within that folder are the measurements for each driver measured during the room measurement, or each speaker measured if the drivers were measured concurrently. The PDC Configurations Folder The PDC Configurations folder has sub-folders as shown below. Within the PDC Configurations folder can be any number of configuration folders. Each of these configuration folders corresponds to a configuration that can be written to the PDC. 87

88 Within each configuration folder is a PDC Profiles folder. Within that folder are the four profiles for that configuration Bypass, Profile 1, Profile 2 and Profile 3. These profiles can be renamed by right-clicking on the filter name and choosing Rename. This has been done in the figure above. Note: most items which appear in the Project Explorer can be renamed with this method. Renaming items is useful for finding them more easily in the future. Naming Conventions To find measurements and corrections easily in DEQX project files a convention for naming has been adopted. The naming convention uses a syntax similar to web based URL, where each entity for locating a resource is separated by a forward slash /. Names in DEQX consist of one or more tags separated by the / character. Tag 1/Tag 2 Speakers are named: Manufacturer / Model / Serial Number Example: ACME Audio / Model-XYZ / SN0001 Speaker Measurements are named: User Name Tag (Text version of measurement procedure) example: Measurement done Today (on axis at 4ft, 01-Jan-03) Speaker Corrections are named: Manufacturer / Model / Serial Number / User Name Tag example: ACME Audio / Model-XYZ / SN0001 / Correction 1 88
89 Room Measurements are named: Speaker if the drivers are measured concurrently. example: Left Driver if the drivers are not measured concurrently. example: L2 (Left Woofer) File Types DEQX Cal has two data file types: 1. Project files, with a mzd file extension. A Project file contains the calibration data and settings for a specific sound system. 2. Microphone calibration files, with a mic file extension. A microphone calibration file contains calibration data specific to that microphone. Working with Projects Creating a New Project To create a new project file, choose File-New Project or click the New icon. This will create a new project file named Untitled and close any open projects. When you next click on the Save button, The Save As dialog window will open and you will be prompted to give the Untitled project a new name. Alternatively, you can open the Project Explorer by choosing View - Project Explorer, right-clicking on the Untitled project, and selecting Save and Compress Project As. This will open the Save As dialog window and you will be prompted to give the Untitled project a new name. Opening an Existing Project To open an existing Project, choose File-Open Project or click the Open icon. In the Open dialog browse to the required project file, select it and click Open. This will open the project and close any open projects. Inserting a Project To insert an existing project, choose File-Insert Project. In the Insert Project dialog browse for the required project file and click Open. The project name now appears in the Project Explorer. Any projects that were open before the project was inserted will still be open. The newly inserted project becomes the default project. You can change this by right clicking on any project in the Project Explorer and choosing Set As Active Project. Using the Project Explorer The Project Explorer is a panel that displays objects in a hierarchical structure. Navigating the Project Explorer is similar to navigating folders in the Windows Explorer. Using DEQX Calibrated Reference 89

90 The Project Explorer showing a new project called Project 1 To open a closed folder, double click the folder icon or single-click the + button at its left. To close an open folder, double click the folder or single-click the - button at its left. Right click objects and folders to view a pop-up menu offering options specific to the object or folder. At the top of the Project Explorer is the Manufacturers and Microphones folder. Open the folder to view the MANUFACTURERS and MICROPHONES folders. These folders contain specifications and other general details on speakers and calibrated microphones, not specific to audio system projects. To add a microphone, click on the + sign next to the Manufacturers and Microphones folder, right click on the MICROPHONE folder and chose Install from the pop-up menu. Project folders appear below the Manufacturers and Microphones folder. The Project Explorer can be used to access existing measurements, calibration templates, room measurements and configurations. To view a speaker measurement, open the relevant project. Navigate the Project Explorer by selecting SPEAKERS, then the name of the speaker / measurement format (For example: SuperSound/SS500/L (Single amp) ), then the MEASUREMENTS folder. Right-click on the measurement then choose View from the pop-up menu. To open a calibration template, open the relevant project. Navigate the Project Explorer by selecting CALIBRATION TEMPLATES, then the name of the calibration template (For example: TrebleKlef_Concerto_Bi amp_measurement R (Bi amp) ). Right-click on the calibration template then choose Open from the pop-up menu. To view a room measurement, open the relevant project. Navigate the Project Explorer by selecting ROOM MEASUREMENTS, then the name of the room, then MEASUREMENT POSITIONS, then the name of the measurement position. Right-click on the measurement position then choose View from the pop-up menu. This will open the room measurements for all the speakers measured at that measurement position. You can also drag and drop the room position measurements onto the Equalizer of the PDC Control Panel. To open a configuration, open the relevant project. Navigate the Project Explorer by selecting PDC CONFIGURATIONS, then the name of the configuration. Right-click on the configuration then choose Open from the pop-up menu. Copying and Pasting Measurements, calibration templates and configurations can be copied between projects, using the following procedure. 90
91 Open the Project Explorer in the View menu. Open the project you wish to insert data into (here on in called the destination). Go to the File menu, and select the Insert Project option and select the project you wish to import the data from (here on in called the source). Before trying to copy any other data, copy a 'PDC Configuration' from your source project into the destination via 'drag and drop' in the 'Project Explorer'. This will copy over your PDC profiles AND measurements. You cannot copy over any CORRECTION SET(s) from source to destination; however, these can be recreated from the copied 'PDC Configuration'. Click 'Configure PDC' and the 'PDC Configuration Wizard' will open. Select the destination project, click next, then 'Load an existing PDC configuration', and select the PDC configuration we previously copied over and click 'Finish'. Select a speaker and click 'Open Template'. You will be told that no calibration templates can be found and asked to recreate a template from the selected speaker. Click YES. Repeat the previous step for each speaker within the PDC configuration that uses a different correction filter. Save the destination project. Viewer Wizard The viewer wizard can help you view existing speaker measurements, room measurements and correction filters. Click the Viewer icon. This opens the Viewer Wizard. At the first window of the Viewer Wizard, just click Next, or, if you have more than one project loaded (as per the figure above), select the project that contains the existing measurement or filter, then click Next. 91
92 At the second window of the Viewer Wizard, select the 'Load old measurement or filters into a new viewer' radio button. (Alternatively, if you are used to using the Project Explorer, you can also create a blank viewer, then drag and drop measurements from the Project Explorer into the viewer. Refer to Using the Project Explorer in Working with Projects.) 92

93 Click on the + sign next to the desired type of measurement / filter, then drill down to select the particular measurement(s) or filter(s). For example, click on the + sign next to the Speakers folder, then click on the + sign next to the desired speaker / measurement format combination. This will show measurements and correction filters (if any) for that speaker / measurement format combination. Check the box next to the desired measurement, then click the Next button. The measurement can be displayed in either: 1. The Viewer (the New Viewer option in the drop-down box shown in the figure above) 2. The Equalizer tab of the PDC Control Panel 3. An existing Viewer window (the Viewer (1) option shown in the figure above) - ie one containing another measurement that you loaded into the Viewer previously. Select the window you wish to display the measurement and click the Finish button. 93

94 Speaker Measurement Setup Physical Setup In order to measure a speaker s frequency-response, the speaker should be placed in a location that provides the best measurement results. The speaker and microphone should be located as far as possible from reflecting surfaces, in order to maximize the duration of the signal that is received prior to the first reflection. This may be best achieved by placing the speaker equidistant from side walls and the rear wall and by using a speaker stand that locates the vertical mid-point of the woofer and tweeter half way between the floor and the ceiling (Assuming the speaker has two drivers, a tweeter and a woofer). It is also necessary to move objects that may cause reflections, such as furniture, away from the measurement area. 94
95 The microphone should be mounted about 2 ft to 3 ft (or 60 cm to 1 metre) from the speaker and lined up with the tweeter axis. Best results will be obtained if you use a microphone stand with a boom to support the microphone. If larger speakers are used it may be necessary to mount the microphone further from the speaker, in order to reduce the angle between the drivers and the microphone (and any associated off-axis effects). However, moving the microphone further from the speaker will potentially increase measured room effects and /or reduce the period of the measurement before the first room reflection, hence the reason for the suggested distance of 3 feet. Better results may be obtained by measuring the speaker outside, provided that a quiet location is used. One method, particularly useful for large speakers, is to rest the speaker on the ground, pointing up at a 45 degree angle. The microphone should still be lined up with the speaker's driver axis, i.e. it will be pointing down at the speaker at a 45 degree angle. When measured with this method, the speaker measurement can be similar to that obtainable in an anechoic chamber. Other Setup The microphone should be connected to the PDC using the microphone cable supplied with the analysis kit. Note: the microphone input has 45 V phantom power on it. Some microphones need time to 'settle', after connecting them to a phantom power source, and prior to making a measurement, so you should ensure that you have plugged the microphone into the PDC at least one minute prior to performing a measurement. Each microphone has a unique calibration profile, determined by measurement of that microphone by DEQX or the microphone manufacturer. The calibration profile for the microphone is supplied in a microphone file, with a.mic extension, provided on the CD supplied with the PDC. To ensure that speaker measurements are accurate, the calibration profile for the microphone must be installed on your PC before any speaker measurements are carried out. Note: We do not support or recommend the use of microphones other than those supplied by DEQX. 95
96 The speaker to be measured should be connected to the user s power amplifier. The inputs of the power amplifier should be connected to the appropriate outputs of the PDC. Refer to Speaker Wiring and Amplifier Connection in the PDC-2.6 and PDC-2.6P User s Manual. Before carrying out a speaker measurement, you should ensure that all forms of extraneous noise have been eliminated or at least reduced as much as possible. For example, close doors to other rooms and turn off fluorescent lights and air conditioners. Note: DEQX s measurement process reduces the effects of extraneous noise, nevertheless less extraneous noise will provide a more accurate speaker measurement. Speaker Measurement Parameters A number of parameters, set in the Measurement Wizard, identify the speaker measurement and record details about the measurement. These are 1. Speaker Manufacturer 2. Speaker Model 3. Speaker Serial Number 4. Measurement Name 5. Measurement Distance (the horizontal distance from the microphone to the speaker) 6. Measurement Angle (the angle between (i) the horizontal speaker axis and (ii) the horizontal line between the microphone and the centre of the front of the speaker) 7. Measurement Height (the height of the microphone from the floor) A number of parameters, set in the Measurement Wizard, affect the speaker measurement. These are 1. Measurement signal sweep duration 2. Number of sweeps 3. Tweeter (and midrange driver) minimum measurement frequency The measurement signal is a log sweep. DEQX's research has determined that a log sweep yields better results and better signal to noise ratios than other signals, such as white noise, pink noise and psuedo-impulse signals. The measurement signal sweep duration can be set between 0.4 seconds and 2.8 seconds. A shorter duration allows faster speaker measurement, but longer signals can yield better measurement results, including higher confidence (see Confidence in the Glossary). 96
97 The number of sweeps can be set between 1 and 36. Fewer sweeps allows faster speaker measurement, but more sweeps can yield better measurement results, including higher confidence. The sweeps are added together and averaged to reduce the effect of discontinuous noises during the measurement. The tweeter (and midrange driver) minimum measurement frequency are set in order to protect the tweeter and midrange driver from low frequencies that may damage such drivers. The high pass filter that provides this protection can be disabled if the 'tweeter' or 'mid-range driver' being measured is actually a full-range or near-full-range driver. Advanced features: If you have previously performed a speaker measurement and wish to run your new speaker measurement at the same volume level, check the Skip level settings page tick box. If you wish to perform bi-amp or tri-amp speaker measurements and have the measurement process pause between measurements, so that you can for example adjust the position of the microphone, check the Display prompt in between drivers tick box. Verifying a Speaker Correction Once a pair of speakers has been corrected (See Correcting a Loudspeaker), one or both of the measurements can be verified. To verify a speaker measurement, click on the button. We recommend that the last speaker to be measured be verified, so it will not be necessary to move the speaker or the microphone. The Verification Measurement Wizard will start. The Verification Measurement Wizard defaults to the settings that were used when the measurement was originally carried out. The first dialog lists the correction sets and, within those, the correction filters, that have been generated with the current calibration template. Select the Correction Set and Correction Filter that you wish to verify, then click Next. 97


98 Select the speaker that you wish to verify, then click Next. 98

99 Set the volume to an appropriate level to achieve a similar volume as measured by the microphone as was achieved when the speaker was originally measured, using the Master Volume control on the IO Manager. You may find that the Master Volume has to be set to a different level than was used when the speaker was originally measured. This is because of the cut or boost applied by the correction filter. Click Run to start the verification measurement. 99

 you can adjust the Master Volume, reduce ambient noise and / or increase the")
100 Once the measurement is completed click Next. The next Wizard dialog gives you the option of Accepting the measurement or Retrying. If the confidence (see Confidence in the Glossary of Terms) is too low (less than 20 db) you can adjust the Master Volume, reduce ambient noise and / or increase the number of sweeps, then repeat the measurement. 100

101 if you clicked Accept in the previous dialog, this final dialog will appear, with the verification measurement displayed behind it on the Data Viewer. Click Finish to close the dialog and the Verification Wizard. 101


102 A verification measurement displayed in the Data Viewer DEQX Viewer and Response Charts The Viewer Wizard Data Viewer and Parametric EQ Chart Controls The Data Viewer is used for viewing and manipulating impulse, frequency, phase and group delay response data. 102

103 The following functions are available as buttons or controls within the Data Viewer or on the tool bar. Zooming: or Zoom Out Zoom In The Zoom In control can be used to zoom in on a particular frequency band and / or gain/phase band. The Zoom Out control reverses this process. When Zoom In is selected, the right-mouse button can also be used to zoom out. To zoom in on a specific region, select the Zoom In control, then click and drag over the region of interest. Smoothing - If smoothing is applied using the smoothing slider in the top left hand corner of the Data Viewer window, this will apply to all selected plots - i.e. those plots that are ticked in the box next to the Plot Name. 103

104 Smoothing can also be applied to an individual plot by entering a value in the Smooth column for the relevant plot. 104

105 Gain adjust (scale): o Normalise to 0dB - the selected plots will be shifted in the vertical axis so that they are centered around 0 db, whilst maintaining their relative levels. The scale for an individual plot can also be adjusted by entering a value in the Scale column for the relevant plot. o Reset - this reverses the shift applied by the Normalise to 0dB button. Again, it is applied only to the selected plots. This means, for example, if two plots have been normalised to 0dB, then one plot is de-selected, then Reset applied, then the de-selected plot selected again, one plot will be still normalised and the other plot will be reset. o Sum - this sums the selected plots by creating a new plot called Sum. This plot is shown and the selected or 'source' plots are automatically hidden (ie de-selected). The sum plot is created without smoothing - it has been generated from the original, unsmoothed 'source' plots. 105

106 106

107 Remove - this removes (instead of just hiding) the selected plot Selection: o All o None o Invert These controls are for easy selection and de-selection of plots. All selects / shows all plots that are listed in the rows underneath the chart. None de-selects / hides all the plots. Invert selects / shows the plots that were previously de-selected / hidden and de- selects / hides the plots that were previously selected / shown. Plot Color - the color of a plot line can be changed by clicking on the Col column for the relevant plot and picking from the palette of colors displayed. Plot Line Style - the style of a plot line can be changed by clicking on the Line column for the relevant plot and picking from the line styles displayed. Data Viewer, Parametric EQ and Calibration Chart Controls The following functions are available by right-clicking on the plot area or by clicking on a plot line (this makes the line bold) then right-clicking. Display / Hide: o Title o Y-Axis o Y-Grid o X-Axis o X-Grid Keep zoom after each click - with this clicked, the viewer will remain in 'Zoom In' mode after the Zoom In button has been selected (and similar for Zoom Out), for situations where you may wish to zoom in or zoom out repeatedly. Axes Limits - this allows the horizontal and vertical axes of the chart to be adjusted. Add Point - this function only works in the Parametric EQ or Limits charts Delete Point - this function only works in the Parametric EQ or Limits charts Delete All Points - this function only works in the Parametric EQ or Limits charts 107

108 View - this selects between Impulse-response, Frequency-response, Phase-response and Group Delay Response. Markers - this adds horizontal, vertical or both markers to the chart. These markers can be moved in order to determine the difference in frequency / phase / gain between two points on the chart. With Both chosen, vertical dashed lines are added to the chart, with a marker on each to indicate horizontal position. When a plot line is selected (by clicking on the line) the horizontal markers snap to the plot line. In the calibration charts, the horizontal and / or vertical differences between the markers are displayed in the top right corner of the chart. Properties - this function only works in the Parametric EQ chart, when an EQ point has been added to the EQ. It allows you to edit the Frequency, Gain, Q and Bandwidth of the EQ point. IO Manager Once the profiles are loaded into the PDC and the inputs and outputs of the PDC are connected correctly, the PDC is ready to correct your speakers. Whilst the PC is connected to the PDC, the IO Manager can be used to control the PDC in real-time and to display the current PDC setup. Click on the icon to open the IO Manager. The IO Manager can be used to switch between inputs, switch between profiles, adjust the master volume and fine tune the volume of individual outputs. For example, if you have main speakers working in conjunction with subwoofers, you can adjust the volume of the subwoofers relative to the main speakers by changing the level of L1 and R1 refer to the figure below. If the PDC has a configuration loaded, the current configuration parameters will be displayed

109 One of the primary functions of the IO Manager is to provide access to the Parametric Equaliser for EQ to be applied in real-time. Click on the Equalizer tab to display the EQ window. See Using the Parametric EQ for more details. Click on the Configuration tab to display the current PDC configuration. Click on the Filters tab and click on the Download button to display the current filters in the PDC. The IO Manager in Detail Master Volume - this adjusts the output volume. Click and drag the slider to adjust the volume. Clicking on the Master Volume control makes it active - the crescent symbol becomes yellow, as shown below: When the Master Volume control is active, the volume can also be adjusted in 0.1 db increments by using the up and down arrow keys of the keyboard, and can be adjusted in 3 db increments by using the Page Up and Page Dn keys. The volume can also be increased by 0.1 db by clicking anywhere on the control above the slider, and decreased by 0.1 db by clicking anywhere on the control below the slider. Lastly, if your mouse has a scroll wheel, the volume can be adjusted with it. If the scroll wheel has a 'notched' movement, each movement will change the volume by 3dB. Mute Button - this mutes the output signal. When clicked, the Mute button changes 109
110 appearance from to. Click it again to unmute the output signal. When the user mutes the output signal, the light on the volume control of the PDC will flash to indicate that the volume has been muted. The volume level can be adjusted with the Master Volume and with the volume button on the PDC when the output signal is muted. The adjusted volume will take effect when the output signal is unmuted by the user by pressing the Unmute button. Note - the PDC will automatically mute if the input is set to digital only and there is no digital signal. In this case the Mute button also changes in appearance to case clicking on the button will have no effect.. However, in this Profile Selection - click on one of the four profile buttons to select the corresponding profile as stored on the PDC. Download Button of the PDC Control Panel. - this downloads the current filters from the PDC onto the Filters tab Input Selection The upper drop-down box lets you choose between four options: Microphone Analog Digital Auto - in this mode the PDC will switch to the digital source if it is present, otherwise it will switch to the analog source. Auto only switches between digital and analog. For example, if you have selected RCA as the digital input (see below), then set the input mode to Auto, then connected a digital source to the AES/EBU input, the PDC will not switch from digital RCA to digital XLR. When Microphone is selected as the source, the lower drop-down box lets you select between available microphone calibration files. When Analog is selected as the source, the lower drop-down box lets you select between RCA (unbalanced) and XLR (balanced) inputs. When Digital is selected as the source, the lower drop-down box lets you select between RCA (S/PDIF) and XLR (AES/EBU) inputs. The Mono Button sends the same signal (the left input) through both the left and right output channels. Input Units can be selected when a microphone is the input source. The two options are db SPL and dbfs. Mic Settings - Gain can be on or off. With the gain off (red) a higher voltage input (ie. a higher sound level) can be inputted. Mic Settings - Phantom. This turns microphone phantom power on (when green) and off (red). Both the Behringer ECM8000, Earthworks M30 and Earthworks M23 microphones used in the DEQX Calibration kits require phantom power. Output Selection Output Selection has 3 settings (applies only to PDC-2.6 digital out option: 110 Analog - the output signal is sent only to the analog outputs Digital - the output signal is sent only to the digital outputs if available Analog / Digital - the output signal is sent to all outputs Analog Volume control can be turned on or off (This applies only for the PDC-2.6P model). When Analog Volume is enabled there is still a certain level of digital attenuation available on the digital outputs (up to -12dB), which is automatically provided in order to simply avoid clipping. If you
 is shown as a line above the solid level bar.")
111 change to digital-out only you will also have to disable the Analog Volume. By default preamp PDC models with digital output have Analog Volume disabled. Input Level Meter This shows the instantaneous input level for the left and right channels. As the volume changes, the peak volume (held for 3 seconds) is shown as a line above the solid level bar. The peak volume is also reported at the top of the meter, whilst the instantaneous level is reported at the bottom of the meter. For example, in the figure below the peak left input level, in the 3 seconds prior to the instant in time that this image was taken, was dbfs. The instantaneous left input level was dbfs. Note - the levels shown give correct readings for sine-waves only. To keep the computation overhead low, they use a very simple peak-detection algorithm. Output Level Meter The output level meter's operation is similar to that of the input level meter, except that it shows the output sent to each of the six outputs, after processing. Thus the output levels are affected by the input levels and by the master volume the speaker correction filter any crossovers applied in the PDC configuration any adjustments in gain (see below) made in the IO Manager the room correction filter any adjustments in gain made using the parametric equalizer Gain Adjust allows individual output channels to be adjusted up or down in 0.5 db increments. This can be useful for (say) manual matching of subwoofers and speakers. The gain adjustments for all output channels can be reset to 0 by clicking on the button. The Mute Buttons allow either input channel and any of the output channels to be muted individually. The Solo Buttons allow either input channel and any of the output channels to be soloed. The Polarity Buttons allow the polarity of individual drivers to be swapped. All adjustments using the Mute, Solo and Polarity buttons can be reset by clicking on the button. Status Information The IO Manager provides the following status information: Status: Displays whether the PDC is filtering or measuring. If the word 'filtering' is the color 'yellow', this indicates unstable parametric EQ. (e.g. a parametric EQ has been applied out of bounds, like a frequency of 1.1Hz; the offending EQ point will be disabled as a precautionary measure). If the word 'filtering' is the color 'red', this indicates a 'dropped sample' condition has occurred Digital In, first window: Whether digital in is On, Off, or Muted Digital In, second window: Whether the CD being played has de-emphasis or not Digital In, last window: The sample rate of the received digital signal Digital Out, first window: Whether the digital out signal is synchronised to the internal clock or an external clock (this applies only if the PDC has the digital out option) Digital Out, second window: The sample rate of the output digital signal, or, a message if there is no output digital 111
112 signal (this applies only if the PDC has the digital out option) Serial #: The PDC's unique internal serial number Firmware Ver: The version number of the firmware currently installed on the PDC Status Reg, DSP Cyc/sec, Mode Reg, Free mem words: information that may be used by DEQX for tracing faults. The PDC Control Panel vs the PDC Configuration Window Some of the tabs of the PDC Control Panel and the PDC Configuration Window look similar. For example, they both have a configuration tab, an equalization tab and a filters tab. However, these two windows have different purposes. The PDC Control Panel shows what is currently on the PDC. For example, the configuration tab of the PDC Control Panel shows the configuration of the four profiles on the PDC that the PC is connected to. If you were to connect another PDC to the PC, the data shown in the configuration tab of the PDC Control Panel would change automatically to reflect the configuration of the new PDC. This data is for display only - you cannot edit the configuration directly on the PDC. On the other hand, the PDC Configuration Window shows what is currently on the PC. For example, the configuration tab of the PDC Configuration Window displays the configuration that is currently available for editing on the PC (In fact, you can have more than PDC Configuration Window open at once. You can view and edit one configuration, them move to the other PDC Configuration Window and view and edit the other.) PDC Configuration Types The PDC has two inputs and six outputs. The internal configuration of how outputs are related to inputs is defined by the PDC Configuration. The PDC Configuration is an analog equivalent schematic of the internal digital wiring from inputs to outputs. Outputs are numbered L1-L3 and R1-R3 and inputs are named L and R. The L and R coding refers to a processing channel from input to one or more outputs, i.e. L input is processed by the PDC to produce outputs L1-L3. To maintain consistency DEQX allocates outputs in a fixed order for connection to different speaker configurations. The following convention is used for allocating outputs. 112
113 Output Single Amp Bi- Amp Tri- Amp Subwoofer L1 no connection no connection Woofer 1 Sub 1 L2 Speaker 1 (left) Woofer 1 Mid- range 1 no connection L3 no connection Tweeter 1 Tweeter 1 no connection R1 no connection no connection Woofer 2 Sub 2 R2 Speaker 2 (right) Woofer 2 Mid- range 2 no connection R3 no connection Tweeter 2 Tweeter 2 no connection The PDC Configuration also includes reserved memory space on the PDC Hardware that can be used for storing correction filters. For each Speaker Configuration connected to the PDC Configuration, there can be speaker correction filters to filter the audio signal from input to output. The supported PDC Configurations are listed in the table below. In this table the L and R are assumed to be the left and Right channels respectively. When using multiple PDC units this may not be the case and the actual loudspeaker connected to a channel will depend on the installation. PDC Configuration L Channels Allocated Output R Channels Single Amp with Stereo Subs L2 Left Speaker L1 Left Subwoofer R2 Right Speaker L1 Left Subwoofer Single Amp with Mono Sub L2 Left Speaker L1 Mono Subwoofer R2 Right Speaker R1 Same as L1 L3 Left Tweeter R3 Right Tweeter Bi Amp with Stereo Subs L2 Left Woofer R2 Right Woofer L1 Left Subwoofer R1 Right Subwoofer 113
114 L3 Left Tweeter R3 Right Tweeter Bi Amp with Mono Sub L2 Left Woofer R2 Right Woofer L1 Mono Subwoofer R1 Same as L1 Tri Amp L3 Left Tweeter L2 Left Mid range L1 Left Woofer R3 Right Tweeter R2 Left Mid range R1 Right Woofer PDC Configuration Parameters Each speaker in a configuration can be adjusted using a number of parameters, as set out below. These parameters are set in the Filter Properties box. To open this box, double-click on the box of the appropriate speaker in the configuration window. The configuration parameter options for a tri-amp speaker channel are shown in the following diagram. Main Filter Under this tab there are four options: 1. Use a correction filter for this loudspeaker - this is for adding a correction filter created with the Calibration Wizard. See Configuring the PDC in the step by step section. Limit filters can also be used with this option. 2. Use a crossover filter for this loudspeaker only - this is for using internal crossovers ie 114 crossovers between woofers and tweeters in a bi-amp configuration, or between woofers
115 and mid-range drivers and mid-range drivers and tweeters in a tri-amp configuration, without using a correction filter. Limit filters can also be used with this option. 3. Bypass correction or crossover for this loudspeaker, but still use limit filters - this is for using external limit filters or crossovers (see Limit Filters below) without speaker correction or internal crossovers (say between woofers and tweeters). 4. Disable the processor outputs for this loudspeaker - this option disables the output of the speaker. Limit Filters Each filter can be adjusted by using low pass and / or high pass filters. This can be useful when using a full range speaker in conjunction with a subwoofer. With Butterworth filters, the width (Q) as well as the slope and frequency can be specified. The optimum slope of the sub-woofer's low pass filter and the speaker's high pass filter will depend on the fall off of the sub-woofer as frequency increases and the fall off of the speaker as frequency decreases. Say, for example, that they naturally cross over at about 100 Hz and the speaker's magnitude response drops off rapidly below 100 Hz but the sub-woofer only drops off slowly above 100 Hz. Then in order to achieve a better transition between them, the low pass filter for the sub-woofer should have a higher slope than the high pass filter for the speaker. Note linear phase high-pass and low-pass filters (and consequently linear phase crossovers) create delays in the correction filters for the speakers. This delay is the length of time in milliseconds from the start of the correction filter to the start of the speaker correction impulseresponse and can be up to 15 milliseconds. The length of the delay caused by a linear phase filter is proportional to the slope of the filter and approximately inversely proportional to the frequency of the filter. For example, a linear phase filter with a slope of 48 db per octave and a frequency of 200 Hz will create a delay of 8.02 milliseconds. A linear phase filter with a 115

116 slope of 300 db per octave and a frequency of 2500 Hz will create a delay of 3.85 milliseconds. Linkwitz-Riley and Butterworth filters are a bit more complicated. They do create delay - however it is not universal across the frequency spectrum. For example, a 200Hz/48dB Linkwitz-Riley crossover has a delay around 4 milliseconds around 20Hz, around 6 milliseconds around 200Hz, with the delay dropping down to zero as the stop band is approached. Time Alignment Time alignment can be used to align the audio signal between speakers that are differing distances from the listener. For example, say that your main speakers are 10 feet from the listening position, but the sub-woofer is 14 feet from the listening position. To align these three speakers, the main speakers have to be delayed by a time period equal to the time that sound takes to travel 4 feet. For the left main speaker, double click on the speaker box in the configuration window, then select the Time Alignment tab of the Left: Filter Properties dialog. Set the Units to Feet and enter 4 in the Delay / Offset box. Repeat this for the right speaker. Advanced Options The advanced options are Polarity of each output channel can be changed from 0 to 180 degrees. Each output channel can be set to bypass or off. Refer to the system diagram at the top of this page for details of which filters are bypassed in this bypass mode. We recommend that these settings are not adjusted. Room Measurement Parameters A number of parameters, set in the Room Measurement Wizard, identify the room 116
117 measurement and record details about the measurement. These are 1. Room Name 2. Room Measurement Position A number of parameters, set in the Room Measurement Wizard, affect the room measurement. These are 1. Measurement signal sweep duration 2. Number of sweeps 3. Whether drivers (of a speaker) are measured concurrently or not 4. PDC Profile to be used during the measurement The measurement signal is a log sweep. DEQX's research has determined that a log sweep yields better results and better signal to noise ratios than other signals, such as white noise, pink noise and psuedo-impulse signals. The measurement signal sweep duration can be set between 0.4 seconds and 2.8 seconds. A shorter duration allows faster speaker measurement, but longer signals can yield better measurement results, including higher confidence (see Confidence in the Glossary). The number of sweeps can be set between 1 and 36. Fewer sweeps allows faster speaker measurement, but more sweeps can yield better measurement results, including higher confidence. The sweeps are added together and averaged to reduce the effect of discontinuous noises during the measurement. When drivers (of a speaker) are measured concurrently they may reinforce or cancel each other at certain frequencies near the crossover frequency. This should be allowed for in any room correction and thus DEQX recommends that drivers be measured concurrently. Speaker Calibration Parameters A number of parameters, set in the Calibration Wizard but adjustable before the correction is generated, affect the speaker correction. These are 1. Smoothing 2. Crossover Algorithm 3. Crossover Slope 4. Crossover Frequency 5. Boost Limit 6. Cut Limit 7. Number of Boost/Cut Bands 8. Maximum Group Delay 9. Group Delay Tolerance 10. Magnitude Tolerance Smoothing, as the name suggests, smooths the measured response of the speaker before it is used as an input into the speaker correction process. The process reduces sharp changes in the time, frequency and phase-response on a logarithmic frequency scale. This method provides a more natural smoothing that is more closely correlated with how we actually hear. Smoothing can be used to reduce the effect of reflections or other artefacts in the measured response. 117


118 An anechoic measurement of a speaker, with 75% smoothing The same anechoic measurement, with 100% smoothing 118

119 An in-room measurement of the same speaker, with the first reflection included, with 75% smoothing The same in-room measurement, with 100% smoothing For example, in certain circumstances you may find that it is difficult to perform a speaker measurement without getting reflections early in the measurement, so that it is not reasonable to truncate the measurement before the first reflection. By using smoothing, you can include some early reflections in the measurement, then reduce the effect of those early reflections. It is often useful to use smoothing to avoid correcting small variations in the frequency-response that are actually measurement artefacts rather than variations characteristic of the speaker itself. In the current version of DEQX Cal the Crossover Algorithm to be used with a correction filter is fixed as a Linear Phase algorithm. The Crossover Slope for a crossover can be set anywhere between 48 db per octave and 300 db per octave. When high-slope crossovers are used, each driver operates only in its optimal frequency range, thus reducing beaming (in woofers and midrange drivers) and other undesirable effects. 119

 can be set by the user.")
120 However, the higher the slope of a linear phase crossover, the greater the delay required to implement it. Thus if minimising delay is a priority for you, you may choose to use a lower slope crossover, such as 48 db per octave. Woofer and Tweeter correction filters, with a 48dB per octave crossover Woofer and Tweeter correction filters, with a 300dB per octave crossover The Crossover Frequency (or crossover frequencies for tri-amp templates) can be set by the user. DEQX Cal will warn if the crossover is set below the limit filter frequency used during the 120
121 measurement - for example, if the tweeter was high-pass limited to 2000 Hz during the speaker measurement then the crossover frequency is set by the user to 1500 Hz. The optimum crossover frequency for a combination of drivers is best determined by experimentation and listening - it cannot be reliably determined from inspection of the frequencyresponse alone of the drivers. Fortunately the PDC is ideal for this sort of experimentation, as it allows for the quick creation of filters with a range of crossovers. These different filters can be loaded into the different profiles of one configuration, allowing for quick A-B comparisons of the effect of changing the crossover frequency. The Boost Limit and Cut Limit specify the maximum boost and cut that will be applied in generating the correction filter. These maxima and minima can be set individually for each Boost/Cut Band. The Number of Boost/Cut Bands defaults to the number of amplifiers per stereo channel (ie single-amp: one band, bi-amp: two bands, etc) but can be set to up to 10 for any template regardless of configuration. In the Limits tab the boost and cut limits can be adjusted. This adjustment is provided because in principle the boost should be high enough to provide a flat frequency-response across the audible spectrum, but in practice you may find through experimentation that, for example, too much boost causes distortion, or that significant boosting of low frequencies requires more amplifier power than is available. However, by default the scale is automatically adjusted so that the lower limit of the measured response is 0dB. This generally results in most of the frequency range of the speaker(s) being cut rather than boosted. As an example of the use of the effective frequency range and the boost and cut limits, in the figure above the effective frequency range of the speaker correction is 30 Hz to 20 khz, the boost limit is 6 db below khz and 4 db above khz. The purple (wiggly) line is the Full Range response of the measured speaker, and the red line (flat for most of the effective frequency range) is the Desired Response. The Full Range response is the measured frequency-response of the speaker before it has been corrected, but taking account of the truncation that was done in the anechoic window (see the paragraph on windowing in the section on Correcting a Loudspeaker) and any crossovers set. The Desired Response is an approximation of the frequency-response that will be achieved, given the measured response and the chosen calibration parameters. A brief description of the filter design process The filter correction algorithm corrects in both the time, frequency and phase domains subject to the parameters that the user enters into the user interface. The user specifies the desired corrected frequency-response using the limit filters (as described above), but only a few parameters are required by the user to specify how the phase and time response will be corrected. A certain amount of phase correction can be achieved without introducing any additional delay into the system, but additional phase correction occurs at the expense of introducing delay in the filter. The user can choose how much of this delay is acceptable by specifying the Maximum Delay parameter in milliseconds (thousands of a second). Any design process is not without error, but the uniqueness of the DEQX algorithm is that you can control the amount of error in the correction filter by specifying particular error tolerances. This can be achieved in both magnitude 'ripple' (Magnitude Tolerance), and group delay 'ripple' (Group Delay Tolerance). The routine will design the filters with as much phase and time correction as possible without violating these requirements. The final design parameter specifies how the routine is optimised. This can be specified for Minimum Delay or Minimum Error. A Minimum Delay selection designs a filter that reduces the delay in the filter to a minimum, without exceeding the error bounds. In this case, it is likely that the filter will have errors as large as your specified maximum. A Minimum Error 121
 for that particular delay value.")
122 optimisation will design a filter that typically exceeds both the error tolerances that are specified, but uses all of the delay specified in Maximum Delay. If delay in the filter is not critical, this option is advisable because it produces the best filters (least error) for that particular delay value. In fact, the most phase and time correction can be achieved by specifying the largest amount of Maximum Delay, while optimising for Minimum Error. All of these parameters default to reasonable values, so it is suggested that they not be modified unless you understand the effects of each of them. A brief description of the delay in the PDC The delay discussed above and that can be controlled by the user using the Maximum Delay parameter is just the delay that arises from correcting the frequency and phase of the driver(s) or speaker. This is not the total delay that will be introduced into the system by the PDC. The total delay is Total delay = Processing time (2.33 ms digital to digital and 4.09ms analog to analog) + frequency & phase correction delay + linear phase crossover delay + automated driver alignment delay + manual speaker alignment delay The linear phase crossover delay will be present only if you are using linear phase crossovers - ie if you have a bi-amp or tri-amp configuration, or if you have used linear phase crossovers between main speakers and subwoofers. The automated driver alignment delay arises from the relative delay between drivers as detected during the measurement process. This figure will also allow for any time alignment between the drivers of a pair of speakers that are corrected together. The manual speaker alignment delay is an optional delay set by the user to time-align speakers that are differing distances from the listening position. This is set during PDC configuration - see PDC Configuration Parameters. File Import Wizard The PDC Import Wizard can be used to import MLSSA (.TIM) files, (provided that they have a sample rate of 48kHz) and text based files such as frequency-response data (.FRD and.fm) files. For more information on text based frequency-response data files go to To start the PDC Import Wizard, choose File - Import Measurement. At the first window of the PDC Import Wizard, just click Next, or, if you have more than one project loaded, select the project into which you wish to import the data, then click Next. At the second window, select the 122
 by selecting the... button. Once the file has been selected, it's full path and name, title, sampling frequency and duration in milliseconds will be displayed.")
123 configuration of the loudspeaker measurements that you wish to import, then click Next. At the third window, enter the path and file name(s) of the data file(s) containing the data you wish to import. You can browse for the file(s) by selecting the... button. Once the file has been selected, it's full path and name, title, sampling frequency and duration in milliseconds will be displayed. Click Next to continue. Note - if the sample rate is not 48kHz, DEQX Cal can be forced to accept MLSSA data by holding down the control key when the Next button is clicked. 123
124 The import wizard allows optimization of the measurements being imported. The optimisation features available depend on the file type being imported. Once you are happy, click Next. The fifth window of the wizard will ask for speaker details, a measurement name and measurement details. Enter these details then click Next. The data will be imported to a speaker measurement with the details you have entered. Click Finish to close the import wizard. DEQX Calibration will now treat the data in the speaker measurement as if it had been measured by the PDC - it can be used in a speaker correction and viewed using the Viewer. 124
.")
125 Setup Options DEQX Cal can be configured in a number of ways. To change the set up options choose Tools- Options. Configuration Tab The Configuration tab is shown below. Hardware - the PDC can be connected to the PC using either a USB cable or an RS232 cable (note - not both simultaneously). If an RS232 cable is used, the appropriate port (ie COM1, COM2, COM3 etc) must be selected. Units - The DEQX Cal software can use either metric or imperial units for distances. Name- Library File - This specifies the location of... The location can be changed by either typing the full path in the dialog box or by finding the desired location using the browse button to the right of the dialog box. Default Project Location - This specifies the default location that projects will be created in, saved in and searched for. The location can be changed by either typing the full path in the dialog box or by finding the desired location using the browse button box. to the right of the dialog 125

126 The following items all do as their names suggest, when the tick box next to them is ticked: Disable Front Panel Controls Reload last project at startup Save project file after each measurement Automatically highlight new items in project Show hint texts in charts The Reset Do No Show Again Warnings button does as the name suggests when clicked. Chart Tab The Chart tab is shown below. The Chart tab allows you to modify the appearance of one or all of the types of charts that are used by DEQX Cal. Chart Name - this allows you to specify which type of chart you wish to modify. If the All Same tick box is ticked, all the charts will be modified. If it is not ticked, you can modify one of the following Standard View - this applies to all charts except those listed below Correction View - the chart on the Correction tab(s) in the Calibration template Limit Design View - the chart on the Limits tab in the Calibration template Crossover Design View - the chart on the Crossovers tab in the Calibration template You can choose whether the following elements of the charts will be shown by default (this can be modified when in the chart): Title 126
 Grid Lines The color and / or font of the following chart elements can be changed: Chart Element Background Plot Background Title X-axis Title Y-axis")
127 X Title X Labels Y Title Y Labels (and if the Y labels Inside tickbox is ticked, the Y Labels will be inside the chart area. Otherwise they will be outside the chart area) Grid Lines The color and / or font of the following chart elements can be changed: Chart Element Background Plot Background Title X-axis Title Y-axis Title Borders and miscellaneous text Grid lines Highlight Shadow Cursors Limit Plot crosshatch Properties Which Can be Changed Color Color Font and Color Font and Color Font and Color Font and Color Color Color Color Color Color 127

128 If the Sync with system colors tickbox is ticked, all the colors and fonts of the chart elements will match the Windows color scheme. PDC Tab The PDC tab is shown below. The PDC tab allows the appearance of the PDC Configuration template to be changed. You can choose whether the following elements of the PDC Configs will be shown: Input/Output Labels Titles Filter Names Drop Shadows The color and / or font of the following elements of the PDC Configuration template can be changed: 128
129 Element Background Wiring Borders Filters Empty Filters Selected Filter Unknown Config Labels Titles Filter Properties Properties Which Can be Changed Color Color Color Color Color Color Color Font and Color Font and Color Font and Color If the Sync with system colors tickbox is ticked, all the colors and fonts of the above elements will match the Windows color scheme. Customization The content and appearance of toolbars, shortcut keys for commands and content of menus can be changed. To change these features choose Tools-Customize. Commands Tab The Commands tab is shown below. The Commands tab allows commands to be moved into and out of toolbars and / or menus. The commands are categorized as they appear in the menus. There is also a category that lists all commands from all menus, in alphabetic order. For example, to add the Options command to the File toolbar, in between the New and Open buttons, click on the Tools category then select Options from the list of commands, as shown below. 129
, the mouse pointer changes in appearance to a small button, with a mouse pointer, next to which is a X")

130 Then drag the Options command to between the New and Open buttons. Whilst being dragged over areas other than the toolbars and menus (i.e. over areas that a command cannot be placed in), the mouse pointer changes in appearance to a small button, with a mouse pointer, next to which is a X to indicate that the command cannot be placed there. When a valid location on a toolbar is reached, a vertical bar appears to show where the command would be inserted, as shown below. When the mouse button is released the command is inserted in the indicated location, as shown below. 130

131 Moving a command to a menu is similar to the example given above for moving a command to a toolbar. When the Command tab is displayed, a command can be removed from a toolbar by clicking on it and dragging it off the toolbar. Similarly a command can be removed from a menu by clicking on it and dragging it off the menu. Toolbars Tab The Toolbars tab is shown below. The Toolbars tab can be used to show or hide toolbars (by clicking on the tickbox to the left of the toolbar name). 131
. New Toolbars can be renamed, using the Rename button. Toolbars can be deleted, using the Delete button.")
132 Individual toolbars or all the toolbars can be reset, restoring the set(s) of buttons in the toolbar(s) to the original set(s). Use the Reset and Reset All buttons. New toolbars can be created (by clicking on the New button). New Toolbars can be renamed, using the Rename button. Toolbars can be deleted, using the Delete button. The text labels for individual toolbars can be displayed or hidden (by clicking on the tickbox next to Show text labels when the toolbar is selected). Note - the Menu Bar, the second 'toolbar' in the list of four toolbars in the figure above, does not have the same properties as the other three toolbars. It cannot be renamed or deleted or have it's text labels hidden. It can only be reset. Keyboard Tab The Keyboard tab is shown below. The Keyboard tab is used to assign or remove keyboard shortcuts to commands. For example, to open the PDC Control Panel by pressing the Alt and I keys simultaneously, 1. From the Category drop down box, select View. 132


133 2. In the Commands box, select PDC Control Panel. 3. Click on the Press New Shortcut Key text entry box. 4. Press the Alt key and I key simultaneously. 'Alt+I' appears in the text box and under the text box the message 'Assigned to: [Unassigned]' appears, indicating that Alt+I is not assigned to any other command. 133


134 5. Click on the Assign button to assign Alt+I to the PDC Control Panel. Alt+I is moved into the Current Keys box, as shown below. 6. Click Close. Options Tab The Options tab is shown below. 134
 for the button.")
135 When the Show Screen Tips on toolbars tickbox is ticked, leaving the mouse pointer above a toolbar button for more than about 0.5 seconds will display a very brief explanation of the button. If the Show shortcut keys in Screen Tips tickbox is also ticked, the explanation will also show a keyboard shortcut (if one has been assigned) for the button. When the Large Icons tickbox is ticked, the toolbar icons are larger than standard. Appendices Contacting DEQX To contact DEQX: support@deqx.com Telephone: +61 (2) Facsimile: +61 (2) Sydney, Australia 135
AcoustiSoft RPlusD ver
 AcoustiSoft RPlusD ver 1.2.03 Feb 20 2007 Doug Plumb doug@etfacoustic.com http://www.etfacoustic.com/rplusdsite/index.html Software Overview RPlusD is designed to provide all necessary function to both
System Requirements SA0314 Spectrum analyzer:
 System Requirements SA0314 Spectrum analyzer: System requirements Windows XP, 7, Vista or 8: 1 GHz or faster 32-bit or 64-bit processor 1 GB RAM 10 MB hard disk space \ 1. Getting Started Insert DVD into
Features/Specifications
 Introduction Thank you for purchasing the DD Audio DSI-1(Digital Signal Integrator). The DSI-1 is a feature rich audio signal processor that will allow you to precisely tune the acoustics of your car audio
Dirac Live for Emotiva Automatic Room Correction
 Dirac Live for Emotiva Dirac Live for Emotiva Automatic Room Correction ENTER Differential Reference Media Controller TUNER 1 2 3 4 5 6 7 8 VOLUME ------------------------------------------ INPUTS ------------------------------------------
NOTICE. The information contained in this document is subject to change without notice.
 NOTICE The information contained in this document is subject to change without notice. Toontrack Music AB makes no warranty of any kind with regard to this material, including, but not limited to, the
VideoMate U3 Digital Terrestrial USB 2.0 TV Box Start Up Guide
 VideoMate U3 Digital Terrestrial USB 2.0 TV Box Start Up Guide Compro Technology, Inc. www.comprousa.com Copyright 2001-2005. Compro Technology, Inc. No part of this document may be copied or reproduced
Wireless Studio. User s Guide Version 5.1x Before using this software, please read this manual thoroughly and retain it for future reference.
 4-743-161-12 (1) Wireless Studio User s Guide Version 5.1x Before using this software, please read this manual thoroughly and retain it for future reference. DWR-R01D/R02D/R02DN/R03D 2018 Sony Corporation
D-901 PC SOFTWARE Version 3
 INSTRUCTION MANUAL D-901 PC SOFTWARE Version 3 Please follow the instructions in this manual to obtain the optimum results from this unit. We also recommend that you keep this manual handy for future reference.
Transmitter Interface Program
 Transmitter Interface Program Operational Manual Version 3.0.4 1 Overview The transmitter interface software allows you to adjust configuration settings of your Max solid state transmitters. The following
CPH-10 SUBWOOFER OWNERS MANUAL
 CPH-10 SUBWOOFER OWNERS MANUAL www.artcoustic.com Welcome to the world of Artcoustic! Congratulations with your purchase of the Artcoustic CPH-10 Subwoofer. The CPH-10 has an efficient design, producing
Audyssey MultEQ Pro User Guide
 Audyssey MultEQ Pro User Guide for the NAD T 775, T 785, and T 175 Audyssey Laboratories, Inc, 350 South Figueroa Street, Suite 233, Los Angeles, CA 90071 www.audyssey.com Table of Contents Introduction...
NOTICE: This document is for use only at UNSW. No copies can be made of this document without the permission of the authors.
 Brüel & Kjær Pulse Primer University of New South Wales School of Mechanical and Manufacturing Engineering September 2005 Prepared by Michael Skeen and Geoff Lucas NOTICE: This document is for use only
White Paper JBL s LSR Principle, RMC (Room Mode Correction) and the Monitoring Environment by John Eargle. Introduction and Background:
 and the Monitoring Environment by John Eargle. Introduction and Background:") White Paper JBL s LSR Principle, RMC (Room Mode Correction) and the Monitoring Environment by John Eargle Introduction and Background: Although a loudspeaker may measure flat on-axis under anechoic conditions,
White Paper JBL s LSR Principle, RMC (Room Mode Correction) and the Monitoring Environment by John Eargle Introduction and Background: Although a loudspeaker may measure flat on-axis under anechoic conditions,
Eventide Inc. One Alsan Way Little Ferry, NJ
 Copyright 2017, Eventide Inc. P/N: 141263, Rev 5 Eventide is a registered trademark of Eventide Inc. AAX and Pro Tools are trademarks of Avid Technology. Names and logos are used with permission. Audio
Fully ly Automaticti. Motorised Satellite t TV System. User s manual REV
 REV. 1.0 Fully ly Automaticti Motorised Satellite t TV System User s manual Customer Help Line: 1300 139 255 Support Email: support@satkingpromax.com.au Website: www.satkingpromax.com.au www.satkingpromax.com.au
Noise Detector ND-1 Operating Manual
 Noise Detector ND-1 Operating Manual SPECTRADYNAMICS, INC 1849 Cherry St. Unit 2 Louisville, CO 80027 Phone: (303) 665-1852 Fax: (303) 604-6088 Table of Contents ND-1 Description...... 3 Safety and Preparation
Calibrating Measuring Microphones and Sound Sources for Acoustic Measurements with Audio Analyzer R&S UPV
 Product: R&S UPV Calibrating Measuring Microphones and Sound Sources for Acoustic Measurements with Audio Analyzer R&S UPV Application Note 1GA47_0E This application note explains how to use acoustic calibrations
ExtIO Plugin User Guide
 Overview The SDRplay Radio combines together the Mirics flexible tuner front-end and USB Bridge to produce a SDR platform capable of being used for a wide range of worldwide radio and TV standards. This
DIGITAL SPEAKER MANAGEMENT UK
 DSM2-6mkII DIGITAL SPEAKER MANAGEMENT 170.659UK Features 96kHz sampling frequency, 32-bit A/D and D/A converter, 24-bit DSP processor Input channel: 6-band parametric EQ, Delay, Polarity Output channel:
A Straightforward One-Seat Stereo Tuning Process and Some Notes About Why it Works
 A Straightforward One-Seat Stereo Tuning Process and Some Notes About Why it Works The Process Note 1: This process assumes the input to your DSP is confirmed as a flat, two-channel and in phase signal,
MaxView Cinema Kit Quick Install Guide
 SYSTEM SETUP The MaxView will work at any of the following display settings: INSTALLATION MaxView Cinema Kit Quick Install Guide Step 1 - Turn off your computer. Disconnect your monitor s VGA cable from
USB Mini Spectrum Analyzer User s Guide TSA5G35
 USB Mini Spectrum Analyzer User s Guide TSA5G35 Triarchy Technologies, Corp. Page 1 of 21 USB Mini Spectrum Analyzer User s Guide Copyright Notice Copyright 2011 Triarchy Technologies, Corp. All rights
Quick Start for TrueRTA (v3.5) on Windows XP (and earlier)
 on Windows XP (and earlier)") Skip directly to the section that covers your version of Windows (XP and earlier, Vista or Windows 7) Quick Start for TrueRTA (v3.5) on Windows XP (and earlier) Here are step-by-step instructions to get
Skip directly to the section that covers your version of Windows (XP and earlier, Vista or Windows 7) Quick Start for TrueRTA (v3.5) on Windows XP (and earlier) Here are step-by-step instructions to get
Audyssey MultEQ Pro User Guide
 Audyssey MultEQ Pro User Guide for the Denon AVR-5805CI Audyssey Laboratories, Inc, 350 South Figueroa Street, Suite 233, Los Angeles, CA 90071 www.audyssey.com Table of Contents Introduction... 1 MultEQ
2-/4-Channel Cam Viewer E- series for Automatic License Plate Recognition CV7-LP
 2-/4-Channel Cam Viewer E- series for Automatic License Plate Recognition Copyright 2-/4-Channel Cam Viewer E-series for Automatic License Plate Recognition Copyright 2018 by PLANET Technology Corp. All
An AAX Plug-in. Version 1.05 December 7, 2013 LTD East 5th Street Superior, WI USA tel: fax:
 An AAX Plug-in OPERATOR'S MANUAL Version 1.05 December 7, 2013 LTD. 2117 East 5th Street Superior, WI 54880 USA tel: 715-398-3627 fax: 715-398-3279 www.cranesong.com 2013 Crane Song, LTD. Subject to change
Small Room Solutions. High-Quality, Cost-Effective Cinema Audio Products for Small Room Applications
 Small Room Solutions High-Quality, Cost-Effective Cinema Audio Products for Small Room Applications LoudspeakerSystems SC-0 Screen Channel Loudspeaker SC-50 Screen Channel Loudspeaker SC-50 Screen Channel
spiff manual version 1.0 oeksound spiff adaptive transient processor User Manual
 oeksound spiff adaptive transient processor User Manual 1 of 9 Thank you for using spiff! spiff is an adaptive transient tool that cuts or boosts only the frequencies that make up the transient material,
Using Extra Loudspeakers and Sound Reinforcement
 1 SX80, Codec Pro A guide to providing a better auditory experience Produced: December 2018 for CE9.6 2 Contents What s in this guide Contents Introduction...3 Codec SX80: Use with Extra Loudspeakers (I)...4
INSTRUCTIONS FOR USE Pro-Ject A/D Phono Box S
 INSTRUCTIONS FOR USE Pro-Ject A/D Phono Box S Dear music lover, thank you for purchasing an A/D Phono Box S from Pro-Ject Audio Systems. In order to achieve maximum performance and reliability you should
Keysight PXA Signal Analyzer
 Keysight PXA Signal Analyzer Option NF2 Noise Floor Extension Upgrade Notice: This document contains references to Agilent. Please note that Agilent s Test and Measurement business has become Keysight
WAVES Cobalt Saphira. User Guide
 WAVES Cobalt Saphira TABLE OF CONTENTS Chapter 1 Introduction... 3 1.1 Welcome... 3 1.2 Product Overview... 3 1.3 Components... 5 Chapter 2 Quick Start Guide... 6 Chapter 3 Interface and Controls... 7
User s Guide W-E
 Presto! PVR ISDB User s Guide 518100-02-01-W-E-112307-02 Copyright 2007, NewSoft Technology Corp. All Rights Reserved. No portion of this document may be copied or reproduced in any manner without prior
AVTuner PVR Quick Installation Guide
 AVTuner PVR Quick Installation Guide Introducing the AVTuner PVR The AVTuner PVR allows you to watch, record, pause live TV and capture high resolution video on your computer. Features and Benefits Up
Analyze Frequency Response (Bode Plots) with R&S Oscilloscopes Application Note
 with R&S Oscilloscopes Application Note") Analyze Frequency Response (Bode Plots) with R&S Oscilloscopes Application Note Products: R&S RTO2002 R&S RTO2004 R&S RTO2012 R&S RTO2014 R&S RTO2022 R&S RTO2024 R&S RTO2044 R&S RTO2064 This application
Analyze Frequency Response (Bode Plots) with R&S Oscilloscopes Application Note Products: R&S RTO2002 R&S RTO2004 R&S RTO2012 R&S RTO2014 R&S RTO2022 R&S RTO2024 R&S RTO2044 R&S RTO2064 This application
Topic: Instructional David G. Thomas December 23, 2015
 Procedure to Setup a 3ɸ Linear Motor This is a guide to configure a 3ɸ linear motor using either analog or digital encoder feedback with an Elmo Gold Line drive. Topic: Instructional David G. Thomas December
DM1624, DM1612, DM812
 Installation Guide Hardware and Software DM Series Digital Processors models DM1624, DM1612, DM812 LECTROSONICS, INC. 1 Installation Specific Information Only This guide covers only installation related
SR-D8-M, SR-D8-S. (Ver ) SOFTWARE INSTRUCTIONS
 SOFTWARE INSTRUCTIONS") SOFTWARE INSTRUCTIONS active l ine array speak er SYStems SR-D8-M, SR-D8-S (Ver. 1.1.1) Thank you for purchasing TOA's Active Line Array Speaker Systems. Please carefully follow the instructions in this
SOFTWARE INSTRUCTIONS active l ine array speak er SYStems SR-D8-M, SR-D8-S (Ver. 1.1.1) Thank you for purchasing TOA's Active Line Array Speaker Systems. Please carefully follow the instructions in this
SPL Analog Code Plug-ins Manual Classic & Dual-Band De-Essers
 SPL Analog Code Plug-ins Manual Classic & Dual-Band De-Essers Sibilance Removal Manual Classic &Dual-Band De-Essers, Analog Code Plug-ins Model # 1230 Manual version 1.0 3/2012 This user s guide contains
DVB-T Box, USB Monheim/Germany Tel. +49 (0)9091/ Fax +49 (0)9091/ Hama GmbH & Co KG.
9091/ Fax +49 (0)9091/ Hama GmbH & Co KG.") www.hama.de Hama GmbH & Co KG Postfach 80 86651 Monheim/Germany Tel. +49 (0)9091/502-0 Fax +49 (0)9091/502-274 hama@hama.de www.hama.de 00062776-01.05 DVB-T Box, USB 2.0 00062776 L TV USB receiver User
www.hama.de Hama GmbH & Co KG Postfach 80 86651 Monheim/Germany Tel. +49 (0)9091/502-0 Fax +49 (0)9091/502-274 hama@hama.de www.hama.de 00062776-01.05 DVB-T Box, USB 2.0 00062776 L TV USB receiver User
DRM212 DRM215 DRM315 SPECIFICATIONS
 DRM212 DRM215 DRM315 DRM Series Professional Powered Loudspeakers deliver class-leading power via ultra-efficient Class-D amplifiers with next-gen protection and Power Factor Correction technology for
USB-TG124A Tracking Generator User Manual
 USB-TG124A Tracking Generator User Manual Signal Hound USB-TG124A User Manual 2017, Signal Hound, Inc. 35707 NE 86th Ave La Center, WA 98629 USA Phone 360.263.5006 Fax 360.263.5007 This information is
M R X
 MRX 710 / 510 / 310 AWARD-WINNING A/V RECEIVERS ANTHEM ROOM CORRECTION SYSTEM A fantastic-sounding product well worthy of a serious audition don t delay. ~ What Hi Fi on the MRX 700 MRX 710 shown Among
DSP Monitoring Systems. dsp GLM. AutoCal TM
 DSP Monitoring Systems dsp GLM AutoCal TM Genelec DSP Systems - 8200 bi-amplified monitor loudspeakers and 7200 subwoofers For decades Genelec has measured, analyzed and calibrated its monitoring systems
Using the BHM binaural head microphone
 11/17 Using the binaural head microphone Introduction 1 Recording with a binaural head microphone 2 Equalization of a recording 2 Individual equalization curves 5 Using the equalization curves 5 Post-processing
LX20 OPERATORS MANUAL
 LX20 OPERATORS MANUAL CONTENTS SAFETY CONSIDERATIONS page 1 INSTALLATION page 2 INTRODUCTION page 2 FIRST TIME USER page 3 SYSTEM OPERATING LEVELS page 3 FRONT & REAR PANEL LAYOUT page 4 OPERATION page
NJU26125 Application Note PEQ Adjustment Procedure Manual New Japan Radio Co., Ltd
 NJU26125 Application Note PEQ Adjustment Procedure Manual New Japan Radio Co., Ltd Version 1.00 CONTENTS 1.ABSTRACT...2 2.NJU26125 FIRMWARE BLOCK DIAGRAM...2 3.EQUIPMENT...2 4.ATTENTION...2 5.GENERAL FLOW
CI-218 / CI-303 / CI430
 CI-218 / CI-303 / CI430 Network Camera User Manual English AREC Inc. All Rights Reserved 2017. l www.arec.com All information contained in this document is Proprietary Table of Contents 1. Overview 1.1
Modbus for SKF IMx and Analyst
 User manual Modbus for SKF IMx and SKF @ptitude Analyst Part No. 32342700-EN Revision A WARNING! - Read this manual before using this product. Failure to follow the instructions and safety precautions
!! 1 of! 21. Magico Subwoofer Setup and DSP Control Manual. Password: Fact_ory
 Magico Subwoofer Setup and DSP Control Manual Password: Fact_ory Thank you for the purchase of your new Magico S-Sub or Q-Sub. The goal of this setup manual is to first integrate the subwoofer into your
ivw-ud322 / ivw-ud322f
 ivw-ud322 / ivw-ud322f Video Wall Controller Supports 2 x 2, 2 x 1, 3 x 1, 1 x 3, 4 x 1 & 1 x 4 Video Wall Array User Manual Rev. 1.01 i Notice Thank you for choosing inds products! This user manual provides
PicoScope 3000 Series Automotive User guide
 PicoScope 3000 Series Automotive User guide PS3000A044 v1.0 I PicoScope 3000 Series Automotive PC Oscilloscopes Table of Contents 1 Introduction...2...2 1 Overview...2 2 Minimum PC requirements...2 3 Installation
PSP Master Comp. Stereo Mastering Compressor
 PSP Master Comp Stereo Mastering Compressor By using this software you agree to the terms of any license agreement accompanying it. PSP, the PSP logo, PSP MasterComp, and It s the sound that counts! are
TelePresence Cisco TelePresence Synch with Edge95MXP - Troubleshooting
 TelePresence Cisco TelePresence Synch with Edge95MXP - Troubleshooting THE SPECIFICATIONS AND INFORMATION REGARDING THE PRODUCTS IN THIS MANUAL ARE SUBJECT TO CHANGE WITHOUT NOTICE. ALL STATEMENTS, INFORMATION,
SiS 2.0 User guide. Rev. 2.2
 SiS 2.0 User guide Rev. 2.2 COPYRIGHT INFORMATION The information in this user s guide and in the PC programme attached is subject to royalties, being these rights represented by FTE Maximal firm (hereafter
ADINSTRUMENTS. making science easier. MA3300 Audio Monitor. Owner s Guide
 ADINSTRUMENTS making science easier MA3300 Audio Monitor Owner s Guide ADINSTRUMENTS making science easier This document was, as far as possible, accurate at the time of release. However, changes may have
VNS2200 Amplifier & Controller Installation Guide
 VNS2200 Amplifier & Controller Installation Guide VNS2200 Amplifier & Controller Installation 1. Determine the installation location for the VNS2200 device. Consider the following when determining the
Getting Started with the LabVIEW Sound and Vibration Toolkit
 1 Getting Started with the LabVIEW Sound and Vibration Toolkit This tutorial is designed to introduce you to some of the sound and vibration analysis capabilities in the industry-leading software tool
ivw-fd122 Video Wall Controller MODEL: ivw-fd122 Video Wall Controller Supports 2 x 2 Video Wall Array User Manual Page i Rev. 1.
 MODEL: ivw-fd122 Video Wall Controller Supports 2 x 2 Video Wall Array User Manual Rev. 1.01 Page i Copyright COPYRIGHT NOTICE The information in this document is subject to change without prior notice
User Manual. AtlonA. Passive VGA Extender with Wall Plate or Box options up to 330ft over 1 x CAT5/6/7 Cable AT-VGA100-SR and AT-WPVGA-SR AT-WPVGA-SR
 User Manual AtlonA Passive VGA Extender with Wall Plate or Box options up to 330ft over 1 x CAT5/6/7 Cable AT-VGA100-SR and AT-WPVGA-SR AT-WPVGA-SR Receiver Transmitter AT-VGA100-SR Receiver Transmitter
The BAT WAVE ANALYZER project
 The BAT WAVE ANALYZER project Conditions of Use The Bat Wave Analyzer program is free for personal use and can be redistributed provided it is not changed in any way, and no fee is requested. The Bat Wave
USB Mini Spectrum Analyzer User Manual TSA Program for PC TSA4G1 TSA6G1 TSA8G1
 USB Mini Spectrum Analyzer User Manual TSA Program for PC TSA4G1 TSA6G1 TSA8G1 Triarchy Technologies Corp. Page 1 of 17 USB Mini Spectrum Analyzer User Manual Copyright Notice Copyright 2013 Triarchy Technologies,
Manual Version Ver 1.0
 The BG-3 & The BG-7 Multiple Test Pattern Generator with Field Programmable ID Option Manual Version Ver 1.0 BURST ELECTRONICS INC CORRALES, NM 87048 USA (505) 898-1455 VOICE (505) 890-8926 Tech Support
SigPlay User s Guide
 SigPlay User s Guide . . SigPlay32 User's Guide? Version 3.4 Copyright? 2001 TDT. All rights reserved. No part of this manual may be reproduced or transmitted in any form or by any means, electronic or
DVB-T USB SET-TOP BOX
 DVB-T USB SET-TOP BOX User Manual Version: 1.0 (February 2005) TRANSYSTEM INC. No.1-2 Li-Hsin Rd.I Science-Based Industrial Park, Hsinchu, Taiwan Tel:+886-3-5780393 Fax:+886-3-5784111 e-mail: sales@transystem.com.tw
Contents Introduction Safety Cleaning Connections Cartridge gain and loading Technical specification Fig.1 PS.30R/ PS.30RDT rear panel Fig.
 Contents Introduction Safety Cleaning Connections Cartridge gain and loading Technical specification Fig.1 PS.30R/ PS.30RDT rear panel Fig.2 Basic audio connection Fig.3 Removing the lid Fig 4 Gain and
Using Extra Loudspeakers and Sound Reinforcement
 1 SX80, Codec Pro A guide to providing a better auditory experience Produced: October 2018 for CE9.5 2 Contents What s in this guide Contents Introduction...3 Codec SX80: Use with Extra Loudspeakers (I)...4
UltraPioneerAVR3 HSPI User s Guide A HomeSeer HS3 plug-in to enable control of Pioneer A/V Receivers that support the IP & RS232 control system.
 UltraPioneerAVR3 HSPI User s Guide A HomeSeer HS3 plug-in to enable control of Pioneer A/V Receivers that support the IP & RS232 control system. Copyright 2014 ultrajones@hotmail.com Revised 01/20/2014
Metal Electrode Meter
 Metal Electrode Meter INSTRUCTION MANUAL FOR Metal Electrode Meter MODEL 2900 Serial # Date PO Box 850 Carlsborg, WA 98324 U.S.A. 360-683-8300 800-426-1306 FAX: 360-683-3525 http://www.a-msystems.com Version
Contents. 1. General Information. 2. Contents. 3. Operating Instruction. 4. Program update. 5. Trouble Shooting. 6. Specifications
 Contents 1. General Information 1-1. Introduction 1-2. Proper use and operation 1-3. Safety Notes 2. Contents 2-1. Accessory Include 2-2. Name of parts 3. Operating Instruction 3-1. Connection Diagram
Portable Speakers. 3,000 Watt 18" Powered Subwoofer with KLARK TEKNIK DSP Technology, Speaker Modelling and ULTRANET Networking
 Front loaded powered subwoofer for portable PA and installation applications power featuring KLARK TEKNIK Class-D technology KLARK TEKNIK Digital Signal Processing for total system control Speaker modelling
XO-231 USER S MANUAL. Crossover ENGLISH
 XO-231 Crossover ENGLISH USER S MANUAL IMPORTANT SAFETY INSTRUCTIONS For your own safety you should read this section in full first! Risk of electrical shock! Connect the device only to a properly wired
Statement SmartLCT User s Manual Welcome to use the product from Xi an NovaStar Tech Co., Ltd. (hereinafter referred to as NovaStar ). It is our great
. It is our great") LED Display Configuration Software SmartLCT User s Manual Software Version: V3.0 Rev3.0.0 NS110100239 Statement SmartLCT User s Manual Welcome to use the product from Xi an NovaStar Tech Co., Ltd. (hereinafter
LED Display Configuration Software SmartLCT User s Manual Software Version: V3.0 Rev3.0.0 NS110100239 Statement SmartLCT User s Manual Welcome to use the product from Xi an NovaStar Tech Co., Ltd. (hereinafter
Whitepaper: Driver Time Alignment
 Whitepaper: Driver Time Alignment definiteaudio GmbH Peter-Vischer-Str.2 D-91056 Erlangen Tel: 09131 758691 Fax: 09131 758691 e-mail: info@definiteaudio.de Web: http://www.definiteaudio.de Umsatzsteueridentnummer:
ivw-fd133 Video Wall Controller MODEL: ivw-fd133 Video Wall Controller Supports 3 x 3 and 2 x 2 Video Wall Array User Manual Page i Rev. 1.
 MODEL: ivw-fd133 Video Wall Controller Supports 3 x 3 and 2 x 2 Video Wall Array User Manual Rev. 1.01 Page i Copyright COPYRIGHT NOTICE The information in this document is subject to change without prior
FlyTV Express M5 MST-T 2 A 2
 FlyTV Express M5 MST-T 2 A 2 User Manual Animation Technologies Inc. www.lifeview.com Ver: 1.0 Copyright and Trademark Notice 2006 by Animation Technologies Inc. All rights reserved. Information in this
Concert Series ORDERCODE D3470 ORDERCODE D3471 ORDERCODE D3472 D3470 D3471 D3472
 Concert Series ORDERCODE D3470 ORDERCODE D3471 ORDERCODE D3472 D3470 D3471 D3472 Congratulations! You have bought a great, innovative product from DAP Audio. The DAP Audio Concert Series brings excitement
MAD A-Series...Flat Panel Surface Planar Arrays
 HPV TECHNOLOGIES, Inc. 17752 Fitch Irvine, California 92614 MAD A-Series...Flat Panel Surface Planar Arrays...Concert Sound at it s Finest! Flat Panel Surface Planar Arrays describe a new speaker technology
ZYLIA Studio PRO reference manual v1.0.0
 1 ZYLIA Studio PRO reference manual v1.0.0 2 Copyright 2017 Zylia sp. z o.o. All rights reserved. Made in Poland. This manual, as well as the software described in it, is furnished under license and may
PicoScope 2000 Series PC Oscilloscopes
 PicoScope 2000 Series PC Oscilloscopes User guide I PicoScope 2000 Series User Guide Table of Contents 1 Introduction...2...2 1 Overview...2 2 Safety symbols...3 3 Safety warning...3 4 FCC notice 5 CE
Operating Instructions
 Operating Instructions HAEFELY TEST AG KIT Measurement Software Version 1.0 KIT / En Date Version Responsable Changes / Reasons February 2015 1.0 Initial version WARNING Introduction i Before operating
Data Acquisition Using LabVIEW
 Experiment-0 Data Acquisition Using LabVIEW Introduction The objectives of this experiment are to become acquainted with using computer-conrolled instrumentation for data acquisition. LabVIEW, a program
AND OPTIONAL UPGRADE FOR BASS MANAGEMENT AND CROSSOVER
 DDRC-88A 8-CHANNEL AUDIO PROCESSOR WITH DIRAC LIVE TECHNOLOGY AND OPTIONAL UPGRADE FOR BASS MANAGEMENT AND CROSSOVER User Manual minidsp Ltd, Hong Kong / www.minidsp.com / Features and specifications subject
Quick Start. RSHS1000 Series Handheld Digital Oscilloscope
 Quick Start RSHS1000 Series Handheld Digital Oscilloscope General Safety Summary Carefully read the following safety precautions to avoid personal injury and prevent damage to the instrument or any products
EUROPA I PREAMPLIFIER MANUAL VER E5th street Superior WI USA davehilldesigns.com
 EUROPA I PREAMPLIFIER MANUAL VER 1.04 20120521 2117 E5th street Superior WI USA 54880 davehilldesigns.com See the next page for startup switch settings 2011, 2012 Dave Hill Designs Start Up Settings 2
LavryBlack Series Model DA10 Digital to Analog Converter
 LavryBlack Series Model DA10 Digital to Analog Converter Lavry Engineering, Inc. P.O. Box 4602 Rolling Bay, WA 98061 http://lavryengineering.com email: techsupport@lavryengineering.com January 14, 2008
OPERATING GUIDE. HIGHlite 660 series. High Brightness Digital Video Projector 16:9 widescreen display. Rev A June A
 OPERATING GUIDE HIGHlite 660 series High Brightness Digital Video Projector 16:9 widescreen display 111-9714A Digital Projection HIGHlite 660 series CONTENTS Operating Guide CONTENTS About this Guide...
LM-WPS41 HD Caption Adder. User. Manual
 LM-WPS41 HD Caption Adder User Manual 1 Table of Contents 1. Installation Notes 3 2.Product Introduction 5 3. Machine installation 7 4. Software debugging 8 5. Remote Control Description 12 Chapter One
BeoVision Televisions
 BeoVision Televisions Technical Sound Guide Bang & Olufsen A/S January 4, 2017 Please note that not all BeoVision models are equipped with all features and functions mentioned in this guide. Contents 1
Multiband Noise Reduction Component for PurePath Studio Portable Audio Devices
 Multiband Noise Reduction Component for PurePath Studio Portable Audio Devices Audio Converters ABSTRACT This application note describes the features, operating procedures and control capabilities of a
Instruction Guide. USB External PC TV Tuner with Remote Control USBTVTUNER. The Professionals Source For Hard-to-Find Computer Parts
 TV TUNER USB External PC TV Tuner with Remote Control USBTVTUNER Instruction Guide * Actual product may vary from photo Revised: July 27, 2004 (Rev. C) The Professionals Source For Hard-to-Find Computer
User Manual. AtlonA. 1 x 10 VGA with Stereo Audio Distribution Amplifier over CAT5/6 compatible with AT-VGA300RL AT-VGA10SS
 User Manual AtlonA 1 x 10 VGA with Stereo Audio Distribution Amplifier over CAT5/6 compatible with AT-VGA300RL AT-VGA10SS TABLE OF CONTENTS 1. Introduction... 3 2. Package Contents... 3 3. Features...
IoT Toolbox Mobile Application User Manual
 Rev. 0 19 December 2017 User Manual Document information Info Keywords Abstract Content User Manual, IoT, Toolbox The IoT Toolbox is a mobile application developed by NXP Semiconductors and designed for
Installer Guide. Follow these instructions to set up the PowerLite Pro Cinema 1080 projector and HQV video processor.
 Installer Guide Follow these instructions to set up the PowerLite Pro Cinema 1080 projector and HQV video processor. For more information, see the manuals that came with these products. Setting Up the
VNS2210 Amplifier & Controller Installation Guide
 VNS2210 Amplifier & Controller Installation Guide VNS2210 Amplifier & Controller Installation 1. Determine the installation location for the VNS2210 device. Consider the following when determining the
Integrated Circuit for Musical Instrument Tuners
 Document History Release Date Purpose 8 March 2006 Initial prototype 27 April 2006 Add information on clip indication, MIDI enable, 20MHz operation, crystal oscillator and anti-alias filter. 8 May 2006
SREV1 Sampling Guide. An Introduction to Impulse-response Sampling with the SREV1 Sampling Reverberator
 An Introduction to Impulse-response Sampling with the SREV Sampling Reverberator Contents Introduction.............................. 2 What is Sound Field Sampling?.....................................
NanoGiant Oscilloscope/Function-Generator Program. Getting Started
 Getting Started Page 1 of 17 NanoGiant Oscilloscope/Function-Generator Program Getting Started This NanoGiant Oscilloscope program gives you a small impression of the capabilities of the NanoGiant multi-purpose
for the Epson Stylus Pro 4000 User s Guide
 for the Epson Stylus Pro 4000 User s Guide All rights reserved. No part of this publication may be reproduced, stored in a retrieval system, or transmitted in any form or by any means, electronic, mechanical,
PicoScope 4000 Automotive PC Oscilloscopes
 PicoScope 4000 Automotive PC Oscilloscopes User's Manual ps4000a.en-1 Copyright 2008 Pico Technology Ltd. All rights reserved. Contents I Contents 1 Introduction...1 1 Overview...1...1 2 Minimum PC requirements...2