Design of Force Versus Displacement Test Stand
|
|
|
- Carol Griffith
- 5 years ago
- Views:
Transcription

1 Western Michigan University ScholarWorks at WMU Honors Theses Lee Honors College Design of Force Versus Displacement Test Stand Andrew Fritchley Western Michigan University, Follow this and additional works at: Part of the Electro-Mechanical Systems Commons Recommended Citation Fritchley, Andrew, "Design of Force Versus Displacement Test Stand" (2018). Honors Theses This Honors Thesis-Open Access is brought to you for free and open access by the Lee Honors College at ScholarWorks at WMU. It has been accepted for inclusion in Honors Theses by an authorized administrator of ScholarWorks at WMU. For more information, please contact


2 Design of Force Versus Displacement Test Stand Andrew Fritchley Drew Arndt Fabian Venegas Group: Faculty Mentor: Dr. Ghantasala Industrial Mentor: David Phaneuf 11 April 2018
3 1 Disclaimer This project report was written by students at Western Michigan University to fulfill an engineering curriculum requirement. Western Michigan University makes no representation that the material contained in the report is error-free or complete in all respects. Persons or organizations who choose to use the material do so at their own risk
4 2 Abstract Performing mechanical design around sensors is a critical skill which all engineering students should be familiar with. Of equal importance is gathering and correctly interpreting electrical data from engineering tests. The aim of this project is to design a force versus displacement test stand for applications related to the measurement of spring force-displacement correlation. The design uses a strain gauge load cell, and a magnetic linear encoder to provide accurate, repeatable force and travel measurements. A mechanical design to mount each sensor was created based initial project constraints. Finite element analysis was performed on all critical components to ensure that the design meets or exceeds requirements. A data acquisition system was designed for these sensors using a LabVIEW interface. This allowed the force and displacement data to be interpreted and synchronized. The design also features a control interface and a quick-change tool base to promote ease of use. Additionally, the controller also saves gathered test data to a spreadsheet for later use. This apparatus is used to measure springs, solenoids, O-rings, and friction in slide fits. This project helps engineers to work more efficiently and analyze sensitive component interactions.
5 3 Table of Contents Disclaimer... 1 Abstract... 2 Table of Figures... 4 Table of Tables Introduction Project Background Benchmarking Project Constraints Critical Decisions Sensor Selection Project Objectives Project Timeline Design Initial Concept Design of Force Sensor Mount Design of Displacement Sensor Mount Design of Tool Base Finite Element Analysis Frame Tower Load Cell Unit Design of Electrical Hardware Design of LabVIEW Code Project Assembly Calibration Project Expenses Conclusion References Appendix Mechanical Drawings Finite Element Analysis Electrical Drawings LabVIEW CODE ABET Forms... 76
6 4 Table of Figures Figure 1: Existing Force Test Set Up... 8 Figure 2: Existing Frame Figure 3: Existing Frame with Nomenclature Figure 4: Load Cell Figure 5: Encoder Figure 6: Project Gantt Chart Figure 7: Existing Frame CAD Model ISO Figure 8: Existing Frame CAD Model Zoom View Figure 9: Load Cell Explode View Figure 10: Load Cell 2D View Figure 11: Load Cell Section View Figure 12: Load Cell Unit ISO Figure 13: Encoder Exploded View Figure 14: 2D Encoder Figure 15: Load Cell Unit ISO View Figure 16: Encoder Unit Figure 17: Tool Base and Frame Explode View Figure 18: Tool Base Figure 19: Tool Base Section View Figure 20: Alignment Tool Figure 21: Tool Base Alignment Section View Figure 22: Tower Deflection Calculation Figure 23: Tower Load Conditions Figure 24: Tower FEA Deflection Model Figure 25: Load Cell Unit Deflection Model Figure 26: Encoder Counter Signals Figure 27: Load Cell s Wheatstone Bridge Figure 28: LabVIEW Front Panel Figure 29: LabVIEW Back Panel Figure 30: Compression Calibration Best Fit Line Figure 31: Counter Signal Figure 32: DAQ for Load Cell Figure 33: DAQ for the Linear Encoder Figure 34: Advance Timing Figure 35: Gauge Blocks Figure 36: Force Test Stand Calibration Curve Figure 37: Zoomed View of Test Stand Calibration Figure 38: Spring Test Figure 39: Stand Parts Figure 40: Critical Fits and Stack Ups Figure 41: Guide Block... 54
7 Figure 42: Left Guard Figure 43:Carriage Block Figure 44: Carriage Mount Plate Figure 45: Offset Mount Plate Figure 46:Locating Shift Mount Block Figure 47: Load Cell Locating Pin Figure 48: Guide Sleeve Figure 49: Applicator Base Figure 50: Load Applicator Figure 51: Magnetic Track Mount Figure 52: Coupling Bracket Figure 53: Quick Change Tool Base Figure 54: Adapter Proto Plate Figure 55: Force Displacement Test Stand Figure 56: Frame Figure 57: Load Cell ASM Figure 58: Encoder ASM Figure 59: Load Cell Unit Mesh Figure 60: Load Cell Unit FOS Figure 61: Load Cell Unit Von Mises Figure 62: Load Cell Unit Von Mises Back View Figure 63: Tower Von Mises Figure 64: Tower Deflection Figure 65: Tower Strain ESTRN Figure 66: Electrical Cost Figure 67: Electrical Power Supply Figure 68: Electrical Connections Figure 69: Electrical Panel Figure 70: Futek Calibration Sheet Figure 71: LabVIEW Front Panel Figure 72: LabVIEW Back Panel Figure 73: Compression Calibration Best Fit Line Figure 74: Counter Signal Figure 75: DAQ for Load Cell Figure 76: DAQ for the Linear Encoder Figure 77: Advance Timing Figure 78: Spring Test Results Example
8 6 Table of Tables Table 1: Load Cell Decision Matrix Table 2: Load Cell Product Comparison Matrix Table 3: Displacement Sensor Decision Matrix Table 4: Displacement Sensor Product Comparison Matrix Table 5: Gauge Block Displacement Test Data Table 6: Spring Test Data Table 7: Electrical Cost Table 8: Special Order Cost Table 9: Total Cost... 49
9 7 1 Introduction 1.1 Project Background This design effort was made possible by the engineering department at Humphrey Products Company (HPC) in Kalamazoo, Michigan and Western Michigan University. The funded project, provided workspace and tools, and most importantly, set the technical direction. The student team thanks them for their tremendous contribution to this design project. HPC makes a wide range of pneumatic valves, as well as several types of electronic devices used across many industries. They have a large engineering department, in addition to other technical staff that are involved in engineering activities. Because they design and manufacture valves, it is important to be able to test designs to ensure that they function as intended. For this reason, HPC has invested in numerous devices that are used to test different design aspects. Some examples of these devices are fluid flow meters, fluid leak meters, thermal chambers, solenoid impedance test stands, microscopes, and force displacement test stands. Each of these devices allow HPC s technical staff to test aspects of a design and validate specific requirements. Since HPC has made such a large investment in testing, it is important to continue to improve their lab technology to save time and money across their business. While several of the test devices mentioned above are up to date and do not need improvement, one test segment that needs improvement are the force versus displacement test stands. The force versus displacement test stands will be called force test stands for the remainder of this report.

10 8 Figure 1: Existing Force Test Set Up HPC currently has several of these stands, many of which have existed for a long time. One of these devices is shown in figure 1 above. These stands measure the force applied to a body and the displacement along the same axis. The current stands are older, beginning to show signs of wear, and are no longer as accurate as they were earlier in their life. In addition, sensing and data acquisition technology has improved a lot during the last decade, making the hardware and software used in the current force test stands at HPC outdated. The current test stands are manual, meaning that the test engineer must log every force and displacement data point manually. This aspect is not desirable because it is difficult to log the points and continue the test without making errors. A need had been demonstrated for a new test stand design that improves this condition. Another area of improvement is max force rating for the current test stands, they typically have a max rated output of around 10 [lbf]. This is a fairly small force for many engineering applications. Since the current test stands are outdated and operate over a limited range of forces a new design is required to provide HPC technical staff expanded testing capability. In summary, a new force test stand is required for HPC. The design requirements are detailed in a later section. Force test stands can be used in many applications to test the response of a body to an applied force. The stand applies a force on a body to deform or move it, and then accurately measures the displacement of the body as well as the applied force. Engineers can use these to test a wide range of mechanical applications such as: measuring springs and checking
11 9 for linearity, determining the forces applied by solenoids at different positions, forces related to sealing with O-rings and lip seals, and frictional forces in slide fits. All of these are critical to design verification and are useful to engineers. 1.2 Benchmarking Due to the need for a new force test stand, it is important to explore all possibilities before beginning any design work. After meeting with HPC engineers, a rough set of specifications were devised. These specifications are discussed in the project constraints section of the report. Those specifications were then compared with test devices on the market. The project only logical if the proposed project cost was significantly less than an item that is already for sale on the open market. The focus was on products that were already on the market; therefore research had to be conducted to find items that met the specifications. After doing research, the focus narrowed to two different force test devices. Option one was an FSA series design from Imada. It has a travel distance of twelve inches, and max force offerings of 1, 11, 44, 110, 220, and 550 lb. The maximum force and travel distance did not meet the requirement and both sensors provide good accuracy. The device contains a control panel but does not contain software where a force versus displacement graph is presented. The device is motorized, and therefore requires programing before use. This is not desirable as often times HPC engineers do not know the exact travel distance required. The price of the largest version of this stand was $ not including shipping and tax. 1 This option is fairly expensive, and the motor design is a large drawback so other options were explored. Option two was a Schmidt Control Instruments motorized test stand. This product was likely designed and manufactured overseas because a very limited amount of information about it was available. From the product specifications, it was discovered that max force was 5000 [N]. The accuracy of the force measurement is listed as 0.2 % of the max rated voltage of the load cell. The accuracy of the displacement sensors is listed as.001 [mm] which is very precise and exceeds the HPC goal. The price of the system is $6,770 not including tax and shipping. 2 Another feature of this stand is that a motor drives the displacement via a ball screw. This can be 1 SCALES ONLINE 2 Schmidt

12 10 desirable in some cases; however it requires the engineer to know the precise displacement for each test. Having a motorized test stand is a large disadvantage in many cases at HPC considering the fact that many of their tests are unique. Similar comparisons can be made, but a device that meets all HPC s needs could not be found on the market. Many test devices on the market cost well over four thousand dollars, which makes that cost a logical project objective to beat. A target total cost of less than $ is ideal. 1.3 Project Constraints The new force test stand was a single build design and sought to improve the current testing capabilities as much as possible. The design was intended to incorporate the newest sensing technology for both force and displacement. After meeting with HPC engineers early in the project, a set of design guidelines or constraints were created. It was determined that the force sensor was required to measure a force 50.0 lbf in tension and compression and have a resolution of 0.01 lbf. The displacement sensor was required to have a range of approximately 7.0 in and a resolution of in. This provided an improved test set up, as it increased the force measurement range by five times over the current testing capabilities. The new test stand was also to be semi-automated, meaning that the force and displacement data points are logged by the stand controller, not the test engineer. This is a significant improvement over current testing capability at HPC. An existing frame that is shown in figures 2-3 will be modified; it was provided by HPC and will be used to simplify the project. The force constraint is a specification by HPC, and the displacement constraint is the travel distance of the ball screw and carriage block assembly of the frame. Figure 3 shows the critical components of the existing frame. The input handle rotates the ball screw, which in Figure 2: Existing Frame

13 11 turn moves the carriage block up and down. This is how the force will be applied to the test subject. The carriage block has bronze bushings that engage with cylindrical linear guides that keep everything aligned. The project was completed with the support of the HPC engineering team who are well versed in industrial safety standards and will made sure every major design decision was acceptable before proceeding. Figure 3: Existing Frame with Nomenclature 1.4 Critical Decisions Considering the project is centered on accurately measure force and displacement, the selection of both measurement sensors were critical design decisions. For this reason, several
14 12 options were compiled and carefully considered to ensure the best sensor was chosen. Input was gathered from both faculty and industrial mentors before any decision was made. There are several classifications of force sensors that meet the required specifications. These classifications are listed in table 1 below. The best choices for the design of the force test stand are clearly the strain gauge load cells and piezoelectric sensors. They both meet all specifications, offer good resolution and are relatively cost effective. Therefore, these two types of force sensors were the only ones considered for the project. Next a set of specific sensors was compiled and rated on a number of factors. These sensors are compared in table 2. This table was presented to the project s faculty mentor and HPC engineers to justify the final sensor selection. Sensor Type Force Range Requirement Met [N] Accuracy in Force Range [N] Table 2: Load Cell Product Comparison Matrix Cost Compactness Durability Static Measurement Of Med. Force Load Cells (Strain Gauge) Y /- + + Load Cells Hydraulic Y 0.1 +/- +/- + + Piezoresistive N /- Piezoelectric Y /- Manufacturer Description Model Number Table 1: Load Cell Decision Matrix Tension & Rated List Price Compression Output Non Linearity Non Repeatability [mv/v nom ]*[V nom ] [mv] +/- [mv] +/- Max Non Linearity Non Repeatability Force [lb] [lb] +/- [lb] +/- Omega In Line LC LCMFL-200 Y $ Omega S Beam LC LC Y $ Omega S Beam LC (High Overload) LCCE-50 Y $ Futek In Line LC (LCM300) FSH03884 Y $ Futek S Beam LC FSH02086 Y $ Futek S Beam/In LineLC (LRM200) FSH03884 Y $ The selection of the displacement sensor is of equal importance the design. Many different types of displacement sensors were compared to again ensure the best sensor was chosen. The classifications of sensors that met the requirements for the design are shown below in table 3. Each sensor is rated in a variety of categories, and the comparison can also be found in table 3. Based on the four sensor selections the linear variable inductance transducer (LVIT) was ruled out because the range was insufficient for most sensors. Potentiometers were also ruled out because the data isn't accurate enough. This left linear variable differential transformers (LVDT) and linear encoders as the best options to be used as displacement sensors. Next, a set of specific


15 13 sensors were compiled and rated on several factors. These sensors are compared in table 4. This table was presented to our mentor engineers to justify the final sensor selection. Table 3: Displacement Sensor Decision Matrix Table 4: Displacement Sensor Product Comparison Matrix 1.5 Sensor Selection For the force sensor, HPC required the machine to be able to measure a force range of 50 lbf in tension and compression, and have an accuracy of 0.01 lbf. Both sensor options were compared in greater detail in table 2, based on the sensors shown, the strain gauge load cells are the best option because the cost of the product is lower and the accuracy and robustness is higher. The Futek LCM300 load cell was the best option all around based on quality, lead time, mounting flexibility, and price. This choice was affirmed by the faculty mentor and HPC engineers and the electrical design phase began. The physical sensor is shown in figure 4 below. Figure 4: Load Cell

16 14 For the displacement sensor, HPC required the machine to be able to measure a displacement range of seven inches and have an accuracy of better than one thousandth of an inch. Complied sensor options are compared in greater detail in table 4. From the data, linear encoders are the best option because of the cost of the product. The LM10 magnetic linear encoder from Renishaw was the best option all around based on quality, lead time, and price. 3 This choice was presented to our faculty mentor and HPC engineers and upon their approval electrical design was started. The physical sensor is shown in figure 5. Figure 5: Encoder 1.6 Project Objectives To stay organized, the project was broken down into many smaller and tangible objectives. Some of the more complex parts of the project included, mechanical design, electrical design, and programming. These parts are explained in further detail in the design portion of the report, and the general project structure is explained here. First, sensors were selected that met the required specifications. Next, the mechanical design was completed which integrated the sensors with the stand frame via an acceptable type of mount for each sensor. After that, finite element analysis or FEA was completed on the frame and mechanical design using SolidWorks simulation. The results verify that the design functions in an acceptable manner. The electrical design was then completed to integrate the sensors with the correct amplification devices so that a controller can read the force and displacement data and write it to a spreadsheet. Next, the 3 RLS Renishaw
17 15 project was assembled both mechanically and electrically. Finally, a study was performed that ensures the force test stand is producing accurate results. 1.7 Project Timeline To complete the project as described, the design team chose to break the project down into smaller, manageable goals. These goals were used to determine project progress and were essential to completing the project on time and with the correct design process. The project goals are as follows and are listed numerically: 1. Model the existing frame and do FEA analysis to determine if the projected applied loads produce a suitable deflection, 2. Select force and displacement sensors that are appropriate for the force range that is required, 3. Integrate selected sensors into existing stand by designing appropriate mechanical mounts, 4. Design a quick change tool base for the stand to minimize test set up time, 5. Create an electrical hardware design around the sensors and use a controller to gather and record test data, 6. Create a program that will be used by the controller to read and write the data to the appropriate file, 7. Build the force test stand to the design, 8. Debug the design of the stand and test, and verify the accuracy. These major project goals will allow the team to make strong design decisions and provide an optimal force test stand for HPC. The Design of the stand was grouped into in four different sections: the major component selection section, the design section, the assembly section, and finally is the calibration and Figure 6: Project Gantt Chart
18 16 testing section. A better illustration of the timeline is shown in the Gantt chart in figure 5 and the amount of time for each section is based on the difficulty of each section.
19 17 2 Design 2.1 Initial Concept With a plan in place, the focus then shifted to the design of the test stand. First, HPC engineers were consulted about their vision for the project. While working with them, an initial concept for this device was created based on the existing frame and the selected sensors. Within these constraints, the design team began looking at several possible options to mount the selected sensors and ensure the required accuracy and repeatability. First measurements of all the existing components of the stand were gathered and then manually converted to the HPC Solid Edge CAD system. The design team used calipers, micrometers, measurement scales, and gauge pins to record the dimensions. The team then worked to put the data in Solid Edge, which is the main HPC CAD software. The model shown below in figures 7 and 8, gave an accurate geometrical representation of the existing frame. The frame provided mounting constraints for the project and it was clear that the design would need a large offset piece to optimally situate the travel range of the system. The Futek load cell was an in line design: thus a circular end assembly would be an ideal choice. On the electrical side HPC engineers envisioned a neat package centered on an efficient controller. Many controllers were possible, however a logical choice was using a National Instruments controller with LabVIEW as the software package, as both were readily available. The sensors had to be incorporated into a hardware design that provided power to the sensors and ensured protection against overloading. A software design would also be needed to synchronize the test data and write it to a spreadsheet. The project aimed to ensure that the design allows flexibility and documentation for future modification.


20 18 Figure 7: Existing Frame CAD Model ISO Figure 8: Existing Frame CAD Model Zoom View 2.2 Design of Force Sensor Mount Starting from the initial design concept it was clear that a circular end assembly was desirable due to the load cell design, because it was the center of the mechanical design. The specifications and dimensions were gathered from the Futek website 4, and a support engineer was contacted to ensure the product would work in this application. From there, the required mounting dimensions and locations were studied. The travel of the existing frame system was considered and the new design ensured that the maximum amount of system travel is used. Another important consideration was to minimize the weight of mounting components connected to the live end of the load cell. If there was too much weight from the parts on the live end of the load cell, it reduces the load that the sensor can accurately measure in the opposite load direction. 4 Futek
21 19 Figure 9: Load Cell Explode View Given these constraints, a mount plate (figure 9 detail 1) was designed to interface with the carriage block that was a part of the existing frame. A dowel pin and flat edges on the mount plate were used to remove all degrees of freedom and ensure accurate and repeatable location of the component within the system. An offset plate (figure 9 detail 2) was then designed to interface with the mount plate. This plate ensures that the load applicator is in the appropriate point in the system travel to best interface with the tool base portion. The length of the plate was modified near the end of the design process to provide optimal system travel. This plate was also accurately located with dowel pins to ensure that it can be reassembled in the same position. Next, the mount block (figure 9 detail 3) was designed to prepare interfacing with the load cell itself. Since the load cell mounts with in line threads, a ninety-degree transition piece such as this one was required. This piece was also pinned for location purposes. A location pin (figure 9 detail 4) was designed to be inserted into the mount block, this used an accurate fit that ensures
 was designed to engage with the location pin. This will allow the components on the load side of the load cell to be constrained within acceptable limits.")

22 20 the part will always be located precisely. The stationary end of the load cell (figure 9 detail 8) threads into this location piece. Next a guide sleeve (figure 9 detail 5) was designed to engage with the location pin. This will allow the components on the load side of the load cell to be constrained within acceptable limits. Finally, the load applicator (figure 9 detail 7) and applicator base (figure 9 detail 6) were designed to engage with the load cell and guide sleeve. The load application will be used to push on the test specimens and can easily be changed out as tests require. A similar design can be developed for a tension test if required. Figures show different views of the design for clarity. All part names and drawings can be found by reviewing the naming convention and the mechanical assembly drawings shown in the appendix section 7.1. Figure 12: Load Cell Unit ISO Figure 11: Load Cell Section View Figure 10: Load Cell 2D View 2.3 Design of Displacement Sensor Mount In the same manner, given the selected displacement sensor, the team consulted RLS to review the mechanical mounting options. They offered two options to mount the encoder s magnetic scale, one being a stick back adhesive to an appropriately straight plate, and the other being a T-track rail that allows for appropriate alignment. The latter option was chosen for ease of use and adjustability since the system was not a scratch design and would likely need to be
23 21 modified. The bolt on T-shaped option can be seen below in the exploded view in figure 16. It needs a forty-five-degree inverted groove on one side for alignment and uses screws to hold it place. To accomplish this, a long flat plate called magnetic track mount (figure 15 detail 4) was designed. This plate has a datum groove to align the track with the part. It also features datum A (figure 15) which is used to align the scale in the axial direction. Bolts hold this piece in place and it does not have alignment features. This piece is held to a tight flatness tolerance to keep the sensor in the most accurate position possible and was made of 6061-Al so it would have no magnetic effect on the track. Next, the team designed a coupling bracket mount the magnetic read head on the carriage block. This piece was also made of 6061-Al so it would have no magnetic effect on the sensor. The overall encoder assembly design is shown in figures 13 and 14 below. One limitation of the design of the encoder mount is that it does not have and location features. This was due to the fact that the design team was designing around an existing system with no accurate drawings. Another limitation of the system is the parallelism between the linear guides from the existing system and the top surface of the magnetic track. There is not easy way to measure this absolutely, but it was checked with a precision shim and remained consistent for the travel of the system. Overall, the system relies on precise adjustment which is not ideal but is a product of the initial design constraints. This design format provides the most flexibility and completes the design of the sensor mounts.


24 22 Figure 13: Encoder Explode View Figure 14: 2D Encoder View Figure 15: Load Cell Unit ISO View Figure 16: Encoder Unit
25 Design of Tool Base After the sensors are accurately mounted to the system, the next critical part of designing a force test stand is being able to quickly and accurately align parts that are being tested. Due to the fact that the base and the load application do not touch it requires two datum features to align the units. It is also necessary to have an alignment process so that the two subassemblies can be realigned easily. Because HPC currently has extensive fixturing that is designed around a Schmidt type press base, it was decided to use a similar design, so the fixtures can be used for testing. For convenience, a circular location hole will be used in the tool base to constrain four degrees of freedom; a slot and pin (figure 17 detail 14) is used to constrain the fifth degree of freedom, and a set screw (figure 17 detail 13) constrains the final degree of freedom. The quickchange tool base is made of 4140 steel and is hardened to prevent surface damage (figure 17 detail 10). It also has a center location hole which is designed to be engaged by a pin (figure 17 detail 1). The center hole of the quick change tool base is aligned with same axis as the force sensor and linear guides via an alignment piece which is discussed later in this section.


26 24 Figure 17: Tool Base and Frame Explode View Figure 13: Tool Base Figure 19: Tool Base Section View For the fixture a simple flat top plate is designed and other fixturing could be designed later according to need. The flat top plate is made of 4140 steel and is hardened to prevent surface damage. This piece has two very accurate dowel holes for the main center location hole and the secondary dowel pin that prevents rotation. The pins are pressed into the holes to fully constrain them and they are locational clearance fits with the tool base. The set screw engages an angled portion of the main pin to fully constrain the fixture in the tool base. Gravity could also
 as the force applicator.")

27 25 Figure 20: Alignment Tool Figure 21: Tool Base Alignment Section View be used in compression tests. The final mechanical design can be found in figures which shows all of the units assembled. One important consideration for the tool base is that the center alignment hole is on the same axis (co-axial) as the force applicator. To do this the team opted to design an alignment tool that could be used to line up the base with the applicator. First, the location features that were to be used had to be selected. The center hole of the base was an obvious choice for an alignment feature on one side. The other side had a few different choices but needed to be a circular feature. The most convenient surface to use was the guide sleeve, which allowed the pieces to be aligned with minimal disassembly. The guide sleeve was used as one feature and the center hole was used as the other. Second, a single circular piece was designed to do this. It is shown in figure 20. The engagement with all three pieces is shown in figure 21. This aligns the tool base with the load cell unit and the tool base is then bolted down the existing frame with four fasteners.
28 Finite Element Analysis Frame Tower Finite element analysis (FEA) was conducted on the frame tower to ensure that it does not bend outside of acceptable limits. Excessive deflection of the frame could interfere with the data obtained by the sensors. First, a set of hand calculations using MathCAD were completed using beam theory. This gave an idea of the deflection that the tower would see under max load. This can be seen in figure 22 below. To obtain hand calculations, a few assumptions were made. The stand s bottom edge is assumed to be fixed due to the weld being continuous and much stronger than material of the same web thickness. The frame material was taken to be low carbon steel and the material was assumed to be isotropic. The moment of inertia was calculated based on the assumption that the tower did not have a cut at the top meaning. Having a continuous beam simplifies the calculation. that the beam has a constant cross section. Also, the load conditions in the bushings, guides, carriage block, and guide block were assumed to be rigid and simplified to two forces from a free body diagram, this simplification is explained in later in this section. The derivation and result of the hand calculation is shown below in figure 22. This gives a rough idea of how the material functions under the given load. Once the calculations were complete, the next step was to run an FEA model to verify that the tower can carry the required load. The software used in the simulation was SolidWorks Simulation Professional.
29 Figure 14: Tower Deflection Calculation 27


30 28 Figure 15: Tower Load Conditions The force applied on the tower will produce a moment, illustrated in figure 23, which will create two distributed forces on the stand. The forces applied on the stand were calculated by taking the distance from where the force is applied on the test plate, to where the carriage is connected to the stand. This load condition creates a moment which is shown in figure 23. The distance from the moment to where the carriage is screwed to the stand is then divided to obtain the moment applied which direction shown above. A conservative max load estimate is four times the amount the load cell sensor can accurately measure. The 200 lb force on the load cell assembly created a lb force on each of the surfaces where the carriage is attached. The FEA study was done by fixing the bottom surface of the tower, and then applying two pressure loads to the frame at the correct points. The area of each pressure load matched the area of the guide block, and the resulting force for each was 292 lb force. Next, the mesh size and material was added to the simulation. The most important result for this study was for the displacement of the frame at the two points of engagement. The results are shown below in figure 23, the maximum deflection is approximately 0.3 mm which closely matches the result of the hand
31 29 calculation. The stress results from simulation are not shown here as the structure has a large factor of safety. They are included in the appendix of this report. With such a high safety factor it is safe to say that the structure of the tower can carry the 50lb force without altering the test data. Figure 16: Tower FEA Deflection Model Load Cell Unit Next, it was necessary to verify that the geometric mechanical design for the load cell mount will appropriately function. First, the team attempted to perform a set of hand calculations to give an idea of the stresses that are present in the load range required. It was determined that the geometry of the beam caused it to fall outside the Euler beam theory method constraints because the cross section to beam length ratio is too large. Another avenue the team explored
32 30 was the Timoshenko beam theory. This theory takes into account the shearing forces seen by the beam since the cross section is so large compared to the beam length. This theory should provide the best approximation for this problem, however it is not a concept that was presented in the undergraduate curriculum at WMU. The hand calculation was then neglected because of the great deal of time it would take to learn and apply the theory. The FEA analysis will be the only measure of deflection for this unit. Once the hand calculation attempt was complete, the team ran an FEA model to verify that the mechanical design can carry the required load. The software used in the simulation was again Solidworks Simulation Professional. The first step in modeling the load case is fully defining part interactions. It is assumed that the components of the existing strand are rigid and provide a perfect support for the offset mount plate. This is not actually the case but is sufficient for the scope of the project. Since the design uses bolts to fix the components in place, there are many ways to define the contact between the parts. The team explored many different methods including modeling the fasteners, using Solidworks predefined fasteners, or using a bonded surface. Modeling the fasteners and defining them in the model will provide the most accurate results but requires a lot of work. Using the Solidworks Simulation fasteners provide slightly less accurate results and still required a signification amount of work. The final option is to use a bonded surface meaning that the points of the contact surfaces remain in the same orientation (like glue without any shear effects) at the adjoining piece. This is a simplified model but will be accurate as the bolt heads are very close to the edges of the parts, also the members are very thick compared with the width and height. The engaging mount plate surface was fixed, and a force of 75 lbf or 335 N is used in the simulation and is applied to the mount block unit. The full simulation constraints and mesh size are shown in the appendix section 7.2. All of the parts are 4140 steel which was hardened, this material was not available in the Solidworks simulation so 4130 was used which has lower values for both tensile and yield strength. The mesh size used was 0.01 in or mm and is shown in the appendix. First, the stress on the bodies were considered and found to be much lower than the yield stress of the components. The von misses stresses are used to display the stresses, this simply takes the stress sensor at each point and reduces it to a singular scalar value that is compared to the yield strength of the material. The von misses stress plots, engineering strain plots, and factor of safety plots can be found in section 7.2 of the appendix. The safety factor of the design from yielding is over eighteen. Next, the

33 31 deflection of the body was considered and the plot for deflection is shown in figure 25. The maximum deflection seen on the axis of the load cell is approximately.030 mm or.001 inches. This is an acceptable deflection and proves that the design will function under the maximum load condition. Figure 17: Load Cell Unit Deflection Model 2.6 Design of Electrical Hardware After completing the mechanical design of the system, focus shifted to the electrical hardware design. The team had to select a controller that could integrate all selected components. The sensor data sheets were studied to determine how each had to be connected. A Futek amplifier was purchased that magnified the voltage produced by the strain gauge load cell. The strain gauge operated by using a Wheatstone bridge set up with four strain gauges to relate the measured voltage to a physical force. The linear encoder operates by using a precision magnet
34 32 track with an on off magnetic field. The magnet spacing dictates the distance traveled per square wave pulse. The sensor pulses are shown in figure 26, two separate waves are necessary to determine the direction the sensor is travelling. After researching the signals that needed to be acquired and interpreted, the team now selected a controller to use for the project. HPC made their National Instruments 6211 DAQ available to the team for the project. Also both sensors had different power supply requirements; the load cell amplifier required a 24-volt power supply, and the encoder required a 5-volt power supply. The power supplies and sensors each needed fuses to protect the sensitive instruments. Also, terminal blocks, a power switch, and a load limit warning light were included in the hardware design to fulfil all requirements set forth by HPC. The full electrical schematic shown in appendix section 7.3, the design fully meets all safety and functionality requirements. The main components of the electrical design are: Figure 18: Encoder Counter Signals The team decided to build an incremental encoder because it take the amount of travel from a set location provided by the user. There are two main components to a linear encoder the read head which travels along the distance it is being measured and a magnetic rail which is stationary and is as long as the distance that it can travel. The rail is magnetic and switches polarity at a set distance of two micrometers. The read had senses this polarity switch and makes a voltage spike, which can be read by the USB6211 as a digital counter signal. The hardest task of the electrical schematic was making sure the USB6211 could read the encoder. There was talk about making the input signal to the USB6211 differential. This idea was ruled out in seeing the signal had no noise when only a positive A and B signal were introduced. The signal is shown and will be further explain in the LabVIEW section of the report. The speed at which the USB6211 can read is far greater the encoder can output. This also does not take into account that the speed the encoder moves when the test is running, which is far
35 33 less than what the encoder will move. Furthermore, the other sensor the Load cell was an analog output which is easier to understand and program in LabVIEW. Figure 19: Load Cell s Wheatstone Bridge The load cell uses a Full Wheatstone Bridge meaning that all of the resistors shown in figure 27 are strain gauges. The resistors are placed in such a way that when a strain gauge is in compression the opposite is in tension to maximize the voltage difference across the Wheatstone Bridge. The Wheatstone bridge is a set of voltage dividers connected in parallel so when the strain gauge is in compression its resistance decreases. Therefore, when the voltage dividers obtain a set of strain gauges that are in both compression and tension the voltage is either maximized to its limit or minimized depending where the resistors are placed to produce either a large or small voltage drop. From there the voltage is taken between this two voltage divider. The final product will have the electrical components neatly mounted in a panel. As stayed above the final product will have its own 5 V and 24 V power supplies and all sensitive items will be protected with fuses. Also, the design will feature a transistor which will turn on a red light when the load cell hits 50lb. The transistor will be used as a switch for the light to obtain current from the 24 V power supply. 2.7 Design of LabVIEW Code For the electrical design to function, a software code was needed to control everything. For this, a VI was designed using LabVIEW so that it acquires the force and displacement data, synchronizes the data, and writes it to a spreadsheet. The code also included controls to change from SI to US units. The front panel includes a graph of the force and displacement values versus time, which helps engineers, visualize their test while it is running. The current value of the force
36 34 and displacement are also displayed numerically on the front panel for convenience. A large red overload warning light was added to the front panel to prevent accidental loads over the rated limit of 50 lbs. The program works by acquiring data only when the encoder moves. The encoder acquires data at speed far greater than the user can vertically crank the stand, so an alarm was not implemented to the encoder. When all data is obtained from the VI it is then saved in an excel file with the time and date. The DAQ assistant was used to connect each sensor to the software, the setting from the load cell and encoder are shown in figures 32 and 33. The entire lab view design is shown for figures 28 and 29. Advanced timing to the PF0 of the encoder shown above in the electrical design. This lets the VI know to acquire the data when this PF0 has counter voltages flowing. Figure 20: LabVIEW Front Panel
37 35 Figure 21: LabVIEW Back Panel Load Cell For a fee, the Futek calibrated the load cell and amplifier as a pair. The calibration data sheet is shown in appendix 7.3. A best-fit line was created using excel, the slope of this line was the calibration constant. The measured voltage was multiplied by calibration constant to obtain the output force value from the load cell. The load cell followed fundamental sign convention making compression a negative voltage. An additional summation was added to the force to zero the force since there are other components hanging on the load cell in normal conditions. The sleeve assembly and the weights of the parts can be calculated from the drawings shown in appendix 7.1.
38 36 Figure 22: Compression Calibration Best Fit Line Magnetic Encoder The Linear Encoder used two single ended counter signals to measure the distance travelled. The A and B signals from the sensor are used to count the number of pulses encountered. Each pulse represents two micrometers; this allows measurement distance travelled by counting the number of pulses. The reason for two signals is to mark whether the encoder is going in the positive or negative direction. The A signal leading the B by convention is the positive direction. The pulse is a half cycle ahead or behind the other pulse, which is a function of the sensor read head design. In figure 31 below, there is a picture of the counter signal acquired by the DAQ. These square wave pulses are counted to determine the number of increments. Figure 23: Counter Signal
39 37 The presence of noise in the counter signal shown above in figure 31, this could potentially cause problems with signal. The noise would be represented on the plateau and as shown in the graph above. Since all of the lines are crisp, no interference from the electrical circuit or the environment was detected thus making the sensor low noise. If noise was encounter, it can be handled by either increasing the current input by adding a resistor or making the encoder differential. The team did not think these changes were needed due to the testing done in section 3. Figure 24: DAQ for Load Cell
40 38 Figure 25: DAQ for the Linear Encoder Figure 26: Advance Timing
41 Project Assembly Much like the design, assembly was a critical part of this project. Proper assembly of the mechanical and electrical components will cause the system to function correctly. All assembly and testing activities were completed at the HPC product development lab. The cadence for assembly was as follows: frame assembly, load cell assembly, encoder assembly, final mechanical assembly, electrical assembly. After all mechanical parts were machined, and the electrical parts arrived at HPC, the team began assembling the force test stand. The first step in assembly was to rebuild the carriage block and linear guide unit from the stand frame which is shown in figure 3. This was done on a precision ground stone to ensure that the guide blocks, linear guides, and balls screw were in alignment. Since there were no location features this assembly step had great potential for error. The frame and guide were assembled and tested on the stone. After this, the carriage block unit was bolted to the frames tower and aligned by measuring the distance from the edge of the guide block to the tower edge. This is also an imperfect method as there are no location features. Next, the left and right guards were bolted back on the stand frame unit. And finally, the gears and crank handle were reassembled. Next, the load cell unit had to be assembled. This was done in accordance to the design procedure, and the final assembly is shown figures 31 and 32. One of the fits for the load applicator was too tight, therefore material had to be removed on a lathe. This was a simple fix, issues with tight locational fits are typical for mechanical assembly projects. The load cell assembly was then mounted to the frame unit. After this step, loads were applied to the load cell unit, and it was determined that the bushings (figure 33) from the existing frame were much too sloppy. This caused the whole load cell unit and carriage block to rotate when a large load was applied and led to a linear deflection of the load applicator of around twenty thousandths of an inch. After measurement it was estimated that the bushings had around three thousandth of an inch of clearance between the linear guides. It was clear that new bushings were needed to prevent this rotation.


42 40 Figure 31: Full Assembly Front View Figure 32: Full Assembly Isometric View The existing bushings were inserted into the carriage block with lose slide fits and held axially by v-point set screws. This is not desirable as accuracy is lost in the clearance between the two pieces. A better option is to press fit the bushings into the carriage block. After discussing the issue with HPC engineers and machinists, two plans were agreed upon. The first was selecting a new set of bushings from a supplier that are close to the same size. A second option that is more work intensive, was pressing in blank bronze slugs and then reaming the inner diameters to the proper sizes. Option one was explored first, and it involved taking the stock bushing and adjusting the inner diameter of each to the exact dimension required to achieve a tight slide fit with the linear guides. Next, the holes in the carriage block were enlarged to allow the new bushings to be press fit into the holes. This option would only work if axes of the two existing holes in the carriage block were almost exactly parallel. The machinist measured the part and determined that the parallelism was sufficient for option one. Location holes were also added to the guide block parts to ensure that the axes of the linear rails would be sufficiently parallel. This shrunk the entire assembly and required many parts to be slotted to fit correctly. The entire process involved a tremendous amount of skill by HPC machinists and the result fixed

43 41 the problem. The new bushings prevented any noticeable deflection of the carriage block and load cell unit. Figure 33: Bushings in carriage block The next section that had to be assembled was the encoder. This was a simple unit and was assembled as the design specified. Then encoder magnetic track was inserted in the T-track assembly, and it was held in place axially with a small screw (figure 34). This provided great adjustability for the system as many small adjustments would need to be made. The sensor read head and coupling bracket were installed and the spacing was critical. RLS Renishaw provided several tolerances that had to be followed for the optimal accuracy. This was tricky as there were no location features for the mounting points. Careful measurements were taken with calipers to ensure that all tolerances were met. A final check was performed with a plastic shim that was twenty thousandths of an inch thick. The shim test was designed ensure that the read head spacing was consistent throughout the travel distance of the system and proved that the encoder unit was in alignment with the linear guides. The mechanical assembly of the project was complete.

44 42 Figure 34: Side View of Full Assembly After mechanical assembly, the final assembly portion was the electrical design. The mounted sensors could now be connected in accordance with the electrical design. Due to time constraints, the entire electrical design was not followed. A prototype build that functions the same as the design was instead used. The remaining components will be ordered and installed at later date. The prototype set up is shown in figure 35. Notable deviations from the design were: no fuses, switches, lights, or electrical enclosures were used, that the LabVIEW NI-6211 was used as a five-volt power supply, and a bench power supply was used to provide twenty-four volts to the load cell amplifier. The prototype set up provided the same functionality and allowed the team to complete the project on time. The overall electrical and mechanical assembly is shown in figure 36. Now that the entire assembly is complete testing, was carried out on the system.
 traceable gauges. To do this the team decided to perform three separate calibrations.")

45 43 Figure 35: Wiring Circuit for Assembly Figure 36: View of LabVIEW Station connection with Sensors 3 Calibration After system level assembly, the apparatus had to be calibrated with National Institute of Standards and Technology (NIST) traceable gauges. To do this the team decided to perform three separate calibrations. The first was an independent calibration of the load cell using precise weights. This was done by Futek, who was certified by NIST to calibrate sensor and amplifier pairs. The load cell and amplifier pair were connect and five weights between ten and fifty pounds were applied. The resulting voltage was measured and the results were provided with the sensor. The process cost three hundred dollars and provided a calibration curve for the system could then be used to obtain the force voltage relationship. This curve is shown in the LabVIEW portion of the report and was used to find the load cell calibration constant to convert the voltage to a force. The calibration sheets for the load cell are shown in the appendix of this report. The load cell was independently calibrated with NIST traceable gauges, thus making it an accurate measuring device within the limits mentioned in the sensor section. After the force sensor was independently calibrated, the displacement sensor needed to be calibrated as well. It was important to ensure the sensor read head and magnetic track are in proper alignment. A set of precision ground gauge blocks that are NIST certified was used to

46 44 ensure that the encoder was working according to the design. To test the as much of the system range as possible, the test incorporated ¼, ½, ¾, 1, 2, 3 and 4 inch blocks which are shown in figure 32. The load applicator was touched on the top of each gauge block, and the moved down to the tool base top plate after the gauge block was removed. Three trials were completed for each block length and the data is shown in table 5. For each length the distance was measured three times to ensure the data taken was consistent as well as accurate. Figure 27: Gauge Blocks

47 45 Table 3: Gauge Block Displacement Test Data Figure 28: Force Test Stand Calibration Curve
48 46 Figure 29: Zoomed View of Test Stand Calibration The displacement test data and a concise summary are shown in table 5. The results of the test proved that the sensor was working very well, the average systematic error from the gauge blocks test was inches. The three measured values from each gauge block test were plotted against the gauge block height in figure 33. This graph shows the slope of each set of data points via a trend line, where a perfect slope is one, and each of the trials have a slope that is very nearly one. This means that the encoder provides linear data throughout the range of travel. The graph in figure 34 shows a zoom view of five different lines from the displacement test. It shows all of the trials the average of the three trials, and a perfect slope of one. This graph is a good measure of the precision of the displacement measurement as the range of the plot is one thousandth of an inch in both directions. This plot demonstrates the systematic error and it clearly shows that the error is in good agreement with the value from table 5. The last calibration test involved a spring used in one of HPC s valves. These springs had a nominal spring rate of 260lb/in and a 10% tolerance. In addition, the springs had an extended length of 0.5 inches, and a fully compressed length of 0.38 inches. The test was then run from the

49 47 fully compressed length of 0.5 inches, to 0.4 inches, this ensures the spring was not plastically deformed. This test combines force and displacement to ensure that the data is both accurate and repeatable. The spring test set up is shown in figure 38. The test measured the spring in a compression test using a sample of ten springs. The test was performed three times and the rate of each spring was calculated in excel from a trend line. The results are shown in table 6, were gathered by graphing the data points and measuring the slope of a best fit line in excel. An example of a data set is shown in the appendix section 7.5. From table 6 the spring rate values can be compared via the three tests that were performed on each spring. The standard deviation for each spring is shown in the table and is often less than two lbf per inch. This proves that the entire system produces repeatable data and is not susceptible to being used by different operators. Given more time, the team would have liked to run more testing with high precision springs to further prove the functionality of the machine. Figure 30: Spring Test


50 48 Table 4: Spring Test Data 4 Project Expenses Expenditures are a very important aspect of any engineering project, often target costs must be achieved. For this reason, the cost of the entire project was tracked against the project goal cost of $4,000. The electrical components cost summary is shown in table 7. This includes all materials not used in the prototype build, HPC plans to order and complete the project to the design at a later date. The total for all electrical components was $2, Another project expense was in mechanical parts that were not standard, stock items at HPC. The cost for the nonstandard parts and fasteners used for this project are shown in table 8 below. The total cost of these materials was $34.88 which was lower than expected. Table 5: Electrical Cost
 $ 7.10 Mcmaster 92220A183 1/4-20 X 0.500 LHSHCS 1 Screw (Comes in a Pack of 50) $ 9.")
51 49 Table 6: Special Order Cost Special Order Fasteners Cost Vendor Part Number Description Quantity Required Price Each Mcmaster 91585A881 M10 X 24 SS Dowel Pin 1 Pin (Comes in Pack of 5) $ 8.57 Mcmaster 92605A152 M X 30 Set Screw 1 Screw (Comes in a pack of 10) $ 7.10 Mcmaster 92220A183 1/4-20 X LHSHCS 1 Screw (Comes in a Pack of 50) $ 9.15 Mcmaster 6391K629 Bushing for repair 2 Bushings $ 4.29 Mcmaster 6391K628 Bushing for repair 2 Bushings $ 4.29 Total Cost $ Table 7: Total Cost Table 9 shows the total project cost, including the labor cost of the HPC machinists and technical staff. This information was provided by the HPC accounting department. It is easy to see that the unforeseen problem with the bushings caused the project to go slightly over budget. Still, the overall cost of the project is much less than many of the comparable test devices on the open market. Considering the accuracy, simplicity, and robustness of the test, the project easily justified completion at a cost of less than $5, Conclusion As detailed, the force test stand was successfully designed, built and tested, however many improvements could still be made to the system. Due to time constraints, the electrical assembly was a prototype and should be built to the actual design as specified by the drawings. This process is not difficult as many of the parts are from the same source and have very short lead times. The power supplies fuse housings, terminal blocks, amplifier, and DAQ would need
52 50 to be mounted in the large electrical enclosure, which would then be mounted to the frame. The light and power switch would need to be mounted to the sub electrical panel, and would also be bolted to the frame. From there, all necessary wires would be routed and labeled to complete the project as designed. Another improvement that could be made is adding a program element to zero the test displacement values once a load is detected. Because many tests often start with no contact with the test specimen, this feature would not require any data manipulation by HPC engineers. This would be helpful and save time in analyzing the test data. It is also advisable to monitor the noise of the encoder signals if the environment or if the circuit changes. Again, if noise is detected on the signal a resistor can be added to increase the current, or programing LabVIEW using the USB6211 to read differential data that can be provided by the sensor. The encoder comes with a A, A- and B, B- signal pairs, so a differential signal can be acquired which cancels a lot of the noise. The lab testing preformed did not show any noise, so differential was not explored further. Finally, a larger study with more precise springs could be performed to ensure that the device is repeatable and accurate. The team explored all of these options but did not have the resources to complete them. In conclusion, the project met all initial project goals. The team of Western Michigan University students completed a complete mechanical, electrical, and, software design for a high precision force test instrument. The design was then assembled, and despite some issues with the existing frame, the team successfully fixed the issues and tested the system. The project provided a durable, low cost, high accuracy design that will provide accurate force test results for Humphrey Products. Engineers have already successfully used the stand to test actuators, valves, and springs.
53 51 6 References [1] Scales Online "Imada MX2-550 Motorized Test Stand MX2-550-S with distance meter." Retrieved Nov. 2, 2017( [2] Schmidt Control Instruments "Force Displacement Measuring System FSA."Retrieve Nov. 4, 2017( [3] RLS "LM10 Linear Magnetic Encoder" Retrieved Dec. 18, 2017( [4] Futek "Miniature Threaded In Line Load Cell" Retrieved Nov. 25, 2017(
54 52 7 Appendix The appendix section of this report provides detailed drawings, calculations, and figures that were completed as part of the project. 7.1 Mechanical Drawings The mechanical drawings section first shows the naming convention for all mechanical parts used in the project. This table is shown below in figure 39. These parts are mentioned in the report separately but are shown here for clarity. Also, the tolerance stack ups for critical design fits are shown in figure 40 below. This ensured that the proper clearances and tolerances were used. Next, this section shows the detailed mechanical drawings for each of the parts that were designed to complete the project. The drawings are shown below in figures These are the drawings used for fabrication. Finally, the full assembly and subassembly drawings are shown in figures These drawings show how the parts are assembled and any fasteners used in each assembly.


55 53 Figure 31: Stand Parts Figure 32: Critical Fits and Stack Ups


56 54 Figure 33: Guide Block Figure 34: Left Guard

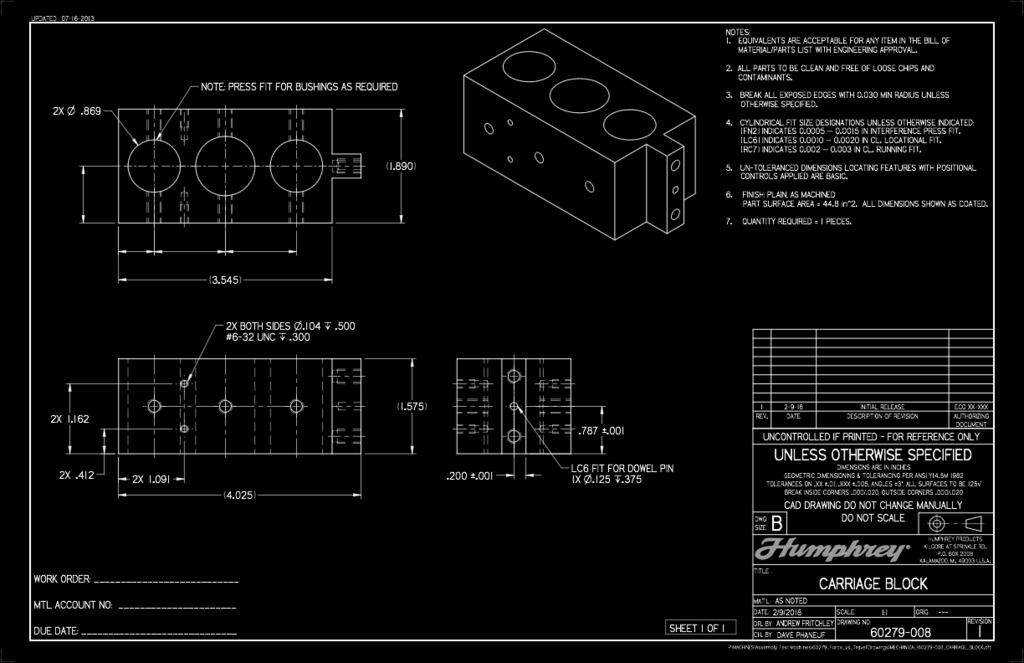

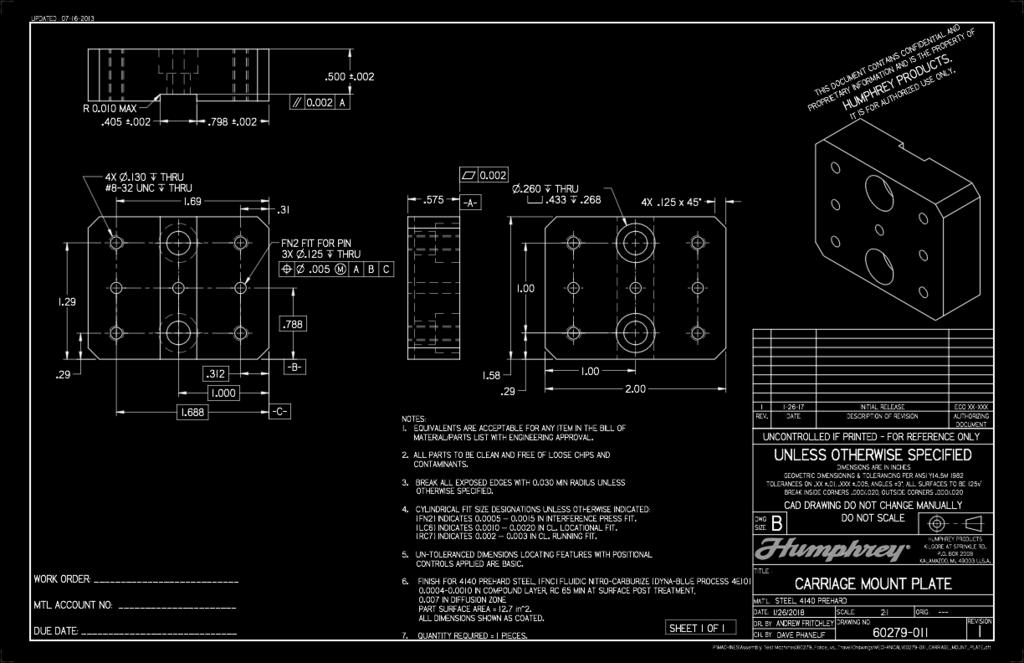
57 55 Figure 35:Carriage Block Figure 36: Carriage Mount Plate


58 56 Figure 37: Offset Mount Plate Figure 38:Locating Shift Mount Block


59 57 Figure 39: Load Cell Locating Pin Figure 40: Guide Sleeve

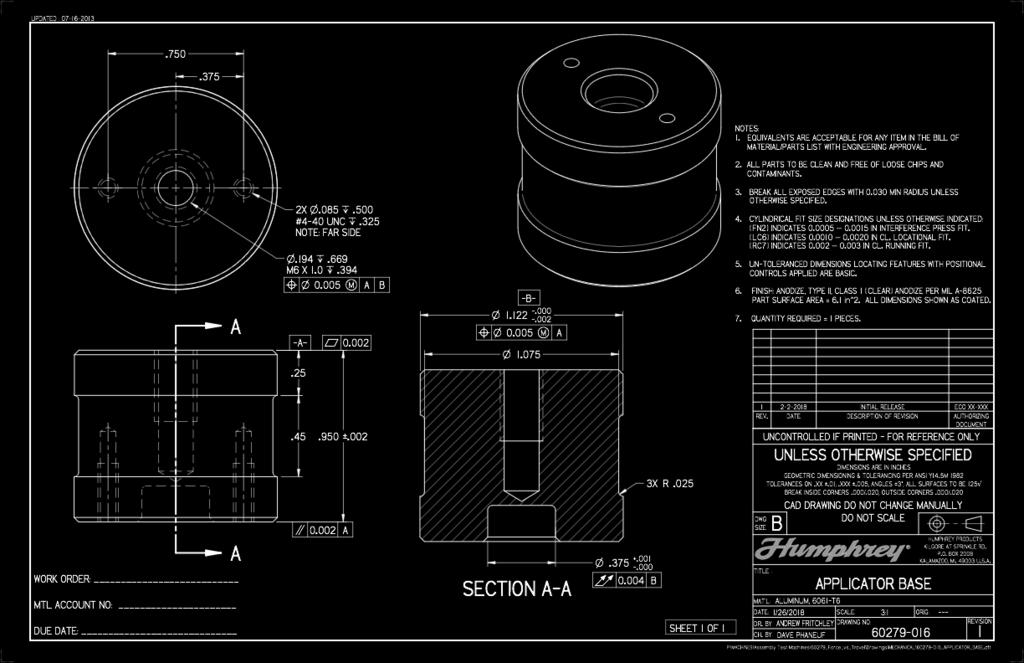
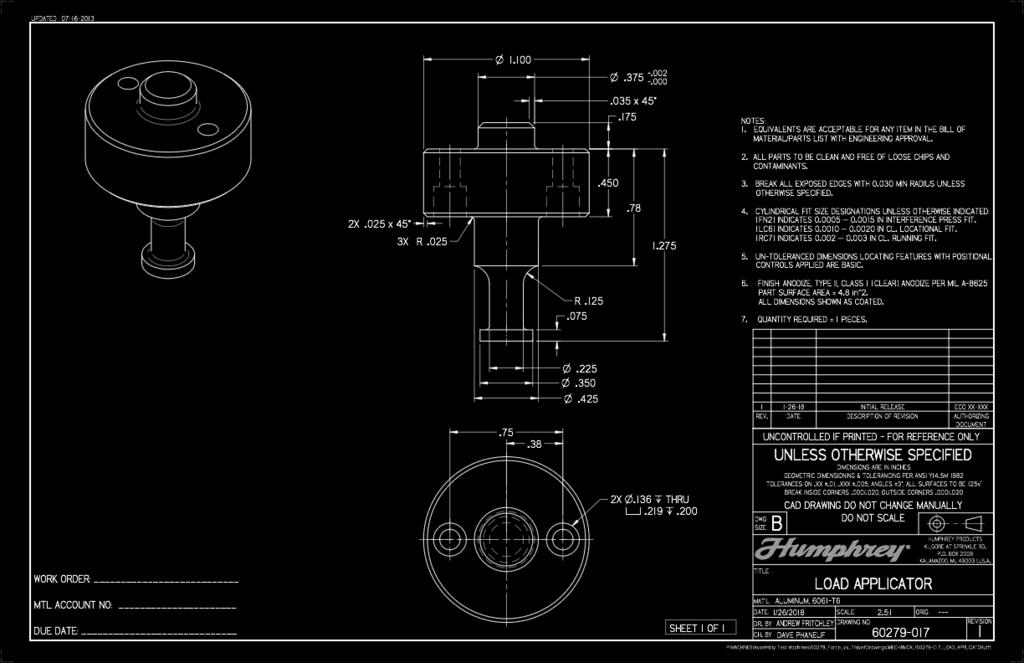
60 58 Figure 41: Applicator Base Figure 42: Load Applicator


61 59 Figure 43: Magnetic Track Mount Figure 44: Coupling Bracket


62 60 Figure 45: Quick Change Tool Base Figure 46: Adapter Proto Plate

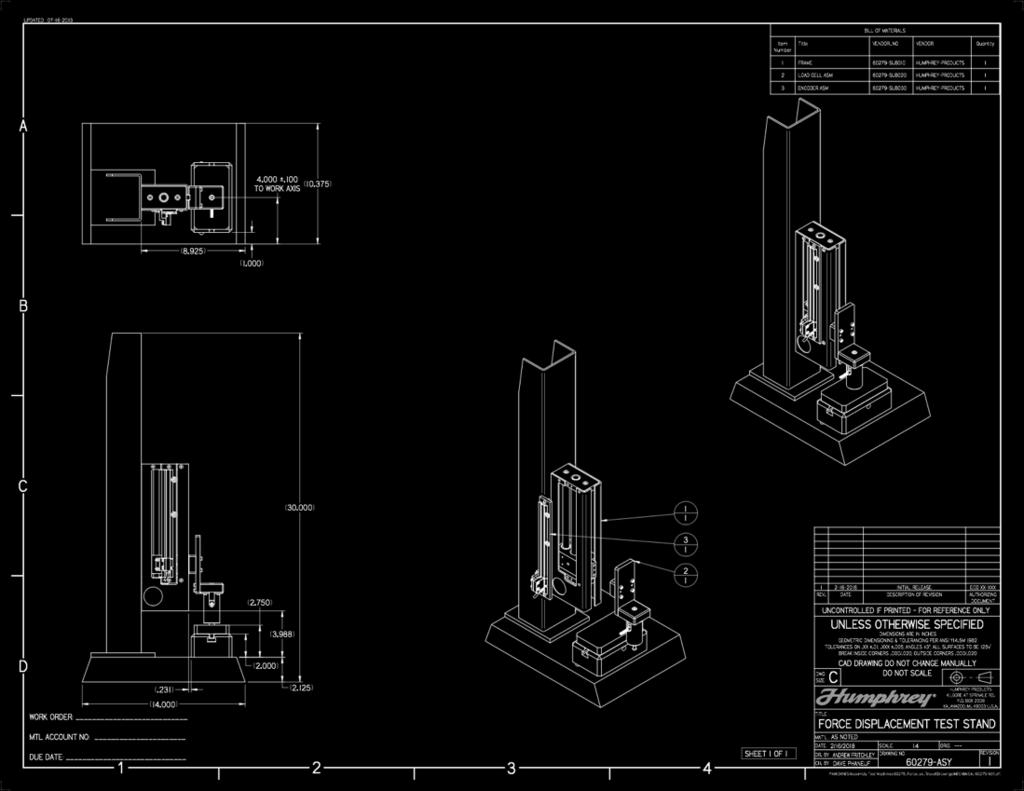
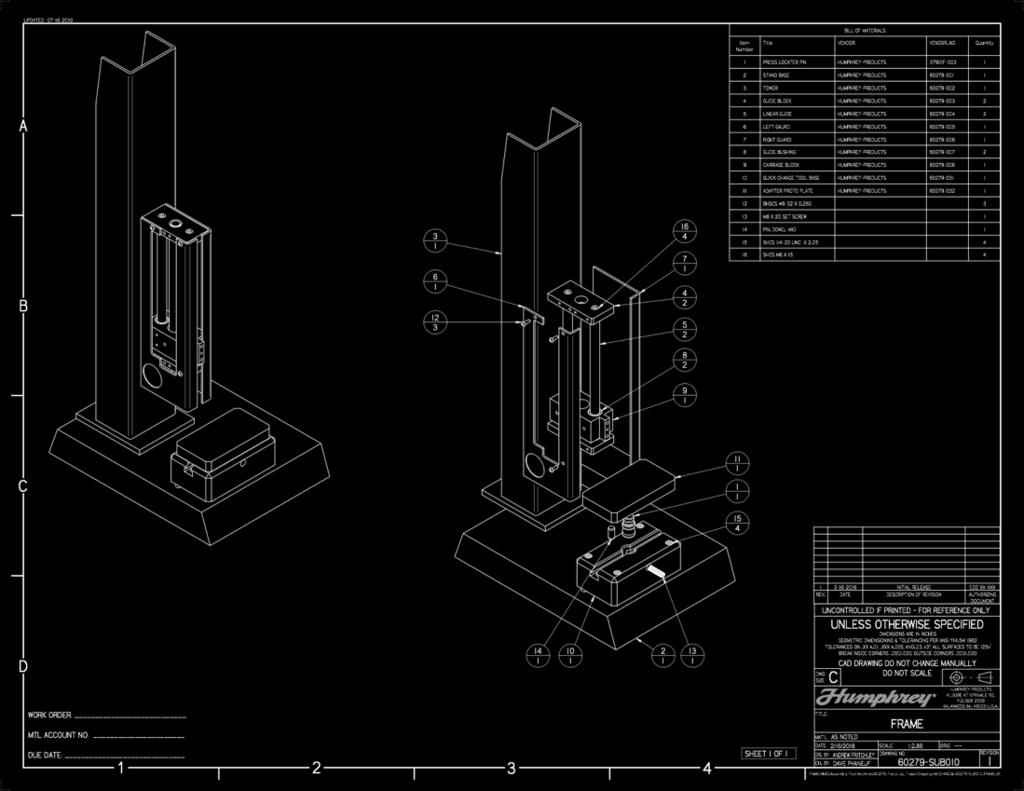
63 61 Figure 47: Force Displacement Test Stand Figure 48: Frame


64 62 Figure 49: Load Cell ASM 7.2 Finite Element Analysis Figure 50: Encoder ASM The FEA section of the appendix section shows relevant FEA graphs generated for this report. First, figures show the FEA analysis on the load cell unit. The analysis was performed to ensure the structure could withstand the required loads. The mesh size, stress graphs, and factor of safety graphs are shown here. The deflection graphs are shown in the design section of the report.

65 63 Figures show the FEA graphs from the tower analysis. The stress and strain graphs are shown while the deflection graph is shown in the design section of the report. Figure 51: Load Cell Unit Mesh

66 Figure 52: Load Cell Unit FOS 64


67 65 Figure 53: Load Cell Unit Von Mises Figure 54: Load Cell Unit Von Mises Back View

68 Figure 55: Tower Von Mises 66
69 Figure 56: Tower Deflection 67

70 68 Figure 57: Tower Strain ESTRN 7.3 Electrical Drawings This section of the appendix shows the detailed electrical design that was completed for this project. Figures show the electrical drawings for the project. This includes all hardware components, wiring diagrams, panel layouts, and DAQ wiring. This is a complete electrical design and can be traced to the explanation in the design section. Also, the calibration certification sheet for the load cell is shown in figure 70 below. This was performed by Futek with NIST traceable gauges.
71 69 Figure 58: Electrical Cost Figure 59: Electrical Power Supply


72 70 Figure 60: Electrical Connections Figure 61: Electrical Panel

73 LabVIEW CODE Figure 62: Futek Calibration Sheet The important LabVIEW pictures are shown in figures below. These include the panels, the A signal from the linear encoder, and the calibration curve for the load cell. In addition, it shows the DAQ assistants for the two cases. These settings are important for understanding and replicating this design.

74 Figure 63: LabVIEW Front Panel 72

75 73 Figure 64: LabVIEW Back Panel Figure 65: Compression Calibration Best Fit Line
Flexible. Fast. Precise. PPU-E Pick & Place Unit
 PPU-E Flexible. Fast. Precise. PPU-E Pick & Place Unit Compact 2-axis unit for a faster, flexible running of any curve on one plane. Field of Application For use in clean and slightly polluted environment.
Axle Assembly Poke-Yoke
 Indiana University Purdue University Fort Wayne Opus: Research & Creativity at IPFW Manufacturing & Construction Engineering Technology and Interior Design Senior Design Projects School of Engineering,
03-Durchfuehren_RZ_0708_EN.qxd:03-Durchfuehren GB.qxd :06 Uhr Seite 200 Feed-through
 Feed-through Feed-through FEED-THROUGH Series Size Page Rotary Feed-through for Robots DDF 202 DDF 031 206 DDF 040 208 DDF 040-1 210 DDF 050 212 DDF 050-1 214 DDF 063 216 DDF 080 218 DDF 080-1 220 DDF
Commissioning the TAMUTRAP RFQ cooler/buncher. E. Bennett, R. Burch, B. Fenker, M. Mehlman, D. Melconian, and P.D. Shidling
 Commissioning the TAMUTRAP RFQ cooler/buncher E. Bennett, R. Burch, B. Fenker, M. Mehlman, D. Melconian, and P.D. Shidling In order to efficiently load ions into a Penning trap, the ion beam should be
OPTIMUM Power Technology: Low Cost Combustion Analysis for University Engine Design Programs Using ICEview and NI Compact DAQ Chassis
 OPTIMUM Power Technology: Low Cost Combustion Analysis for University Engine Design Programs Using ICEview and NI Compact DAQ Chassis World Headquarters (USA): European Sales Office: Japanese Office: 3117
Considerations for Specifying, Installing and Interfacing Rotary Incremental Optical Encoders
 Considerations for Specifying, Installing and Interfacing Rotary Incremental Optical Encoders Scott Hewitt, President SICK STEGMANN, INC. Dayton, OH www.stegmann.com sales@stegmann.com 800-811-9110 The
E X P E R I M E N T 1
 E X P E R I M E N T 1 Getting to Know Data Studio Produced by the Physics Staff at Collin College Copyright Collin College Physics Department. All Rights Reserved. University Physics, Exp 1: Getting to
Cambridge International Examinations Cambridge International General Certificate of Secondary Education
 Cambridge International Examinations Cambridge International General Certificate of Secondary Education *5003676564* DESIGN AND TECHNOLOGY 0445/42 Paper 4 Systems and Control May/June 2015 1 hour Candidates
Mechanical aspects, FEA validation and geometry optimization
 RF Fingers for the new ESRF-EBS EBS storage ring The ESRF-EBS storage ring features new vacuum chamber profiles with reduced aperture. RF fingers are a key component to ensure good vacuum conditions and
SRV02-Series. Rotary Pendulum. User Manual
 SRV02-Series Rotary Pendulum User Manual Table of Contents 1. Description...3 2. Purchase Options...3 2.1 Modular Options...4 3. System Nomenclature and Components...5 4. System Configuration and Assembly...6
CARLITE grain orien TEd ELECTRICAL STEELS
 CARLITE grain ORIENTED ELECTRICAL STEELS M-3 M-4 M-5 M-6 Product d ata Bulletin Applications Potential AK Steel Oriented Electrical Steels are used most effectively in transformer cores having wound or
4.9 BEAM BLANKING AND PULSING OPTIONS
 4.9 BEAM BLANKING AND PULSING OPTIONS Beam Blanker BNC DESCRIPTION OF BLANKER CONTROLS Beam Blanker assembly Electron Gun Controls Blanker BNC: An input BNC on one of the 1⅓ CF flanges on the Flange Multiplexer
Innovative Rotary Encoders Deliver Durability and Precision without Tradeoffs. By: Jeff Smoot, CUI Inc
 Innovative Rotary Encoders Deliver Durability and Precision without Tradeoffs By: Jeff Smoot, CUI Inc Rotary encoders provide critical information about the position of motor shafts and thus also their
Intelligent Pendulum Hardness Tester BEVS 1306 User Manual
 Intelligent Pendulum Hardness Tester BEVS 1306 User Manual Please read the user manual before operation. PAGE 1 Content 1. Company Profile... 3 2. Product Introduction... 3 3. Operation Instruction...
Data Acquisition Using LabVIEW
 Experiment-0 Data Acquisition Using LabVIEW Introduction The objectives of this experiment are to become acquainted with using computer-conrolled instrumentation for data acquisition. LabVIEW, a program
Transducers and Sensors
 Transducers and Sensors Dr. Ibrahim Al-Naimi Chapter THREE Transducers and Sensors 1 Digital transducers are defined as transducers with a digital output. Transducers available at large are primary analogue
Topic: Instructional David G. Thomas December 23, 2015
 Procedure to Setup a 3ɸ Linear Motor This is a guide to configure a 3ɸ linear motor using either analog or digital encoder feedback with an Elmo Gold Line drive. Topic: Instructional David G. Thomas December
Electric Rotary Modules. Rotary Actuators
 Electric Rotary Modules Rotary Actuators Electric Rotary Modules Rotary Actuators ROTARY ACTUATORS Series Size Page Miniature Rotary Actuators MRD-S 224 MRD-S 4 232 MRD-S 8 234 MRD-S 12 236 Explanation
Cambridge International Examinations Cambridge International General Certificate of Secondary Education
 Cambridge International Examinations Cambridge International General Certificate of Secondary Education *7189222356* DESIGN AND TECHNOLOGY 0445/41 Paper 4 Systems and Control October/November 2016 1 hour
CATHODE-RAY OSCILLOSCOPE (CRO)
") CATHODE-RAY OSCILLOSCOPE (CRO) I N T R O D U C T I O N : The cathode-ray oscilloscope (CRO) is a multipurpose display instrument used for the observation, measurement, and analysis of waveforms by plotting
CATHODE-RAY OSCILLOSCOPE (CRO) I N T R O D U C T I O N : The cathode-ray oscilloscope (CRO) is a multipurpose display instrument used for the observation, measurement, and analysis of waveforms by plotting
Obtained from Omarshauntedtrail.com
 http://www.cindybob.com/halloween/ledlighting/ledspotlights/ Introduction In our 2005 haunt providing 120V AC power to the various lights and props requiring it became a fairly large problem. Extension
Optical Technologies Micro Motion Absolute, Technology Overview & Programming
 Optical Technologies Micro Motion Absolute, Technology Overview & Programming TN-1003 REV 180531 THE CHALLENGE When an incremental encoder is turned on, the device needs to report accurate location information
The field cage for a large TPC prototype
 EUDET The field cage for a large TPC prototype T.Behnke, L. Hallermann, P. Schade, R. Diener December 7, 2006 Abstract Within the EUDET Programme, the FLC TPC Group at DESY in collaboration with the Department
Application Note AN-708 Vibration Measurements with the Vibration Synchronization Module
 Application Note AN-708 Vibration Measurements with the Vibration Synchronization Module Introduction The vibration module allows complete analysis of cyclical events using low-speed cameras. This is accomplished
Automated TV Wall Mount
 A Baccalaureate thesis submitted to the School of Dynamic Systems College of Engineering and Applied Science University of Cincinnati in partial fulfillment of the requirements for the degree of Bachelor
Variable Frequency Drive (VFD) Control Lab
 Control Lab") Montana Tech Library Digital Commons @ Montana Tech Proceedings of the Annual Montana Tech Electrical and General Engineering Symposium Student Scholarship Spring 2017 Variable Frequency Drive (VFD) Control
Montana Tech Library Digital Commons @ Montana Tech Proceedings of the Annual Montana Tech Electrical and General Engineering Symposium Student Scholarship Spring 2017 Variable Frequency Drive (VFD) Control
SRV02-Series. Ball & Beam. User Manual
 SRV02-Series Ball & Beam User Manual Table of Contents 1. Description...3 1.1 Modular Options...4 2. System Nomenclature and Components...5 3. System Setup and Assembly...6 3.1 Typical Connections for
NTB-500A. Medium Speed Network Terminal Box. Supports dynamic measurement at medium-speed synchronous sampling!
 Medium Speed Network Terminal Box Supports dynamic measurement at medium-speed synchronous sampling! Decentralized arrangement and synchronous sampling of all channels. Medium Speed Network Terminal Box
Preface 11 Key Concept 1: Know your machine from a programmer s viewpoint 17
 Table of contents Preface 11 Prerequisites 11 Basic machining practice experience 11 Math 12 Motivation 12 Controls covered 12 What about conversational controls? 13 Controls other than Fanuc 13 Limitations
Standard Operating Procedure of nanoir2-s
 Standard Operating Procedure of nanoir2-s The Anasys nanoir2 system is the AFM-based nanoscale infrared (IR) spectrometer, which has a patented technique based on photothermal induced resonance (PTIR),
Optimizing BNC PCB Footprint Designs for Digital Video Equipment
 Optimizing BNC PCB Footprint Designs for Digital Video Equipment By Tsun-kit Chin Applications Engineer, Member of Technical Staff National Semiconductor Corp. Introduction An increasing number of video
THE OPERATION OF A CATHODE RAY TUBE
 THE OPERATION OF A CATHODE RAY TUBE OBJECT: To acquaint the student with the operation of a cathode ray tube, and to study the effect of varying potential differences on accelerated electrons. THEORY:
Twin City Fan & Blower
 Twin City Fan & Blower BULLETIN 315 August 2000 SERIES 2000 DWDI BACKWARD INCLINED FANS TYPE BAB Series 2000 BAB DWDI Backward Inclined Fans This bulletin features our new BAB Series 2000 DWDI (double
A COMPUTERIZED SYSTEM FOR THE ADVANCED INSPECTION OF REACTOR VESSEL STUDS AND NUTS BY COMBINED MULTI-FREQUENCY EDDY CURRENT AND ULTRASONIC TECHNIQUE
 More Info at Open Access Database www.ndt.net/?id=18566 A COMPUTERIZED SYSTEM FOR THE ADVANCED INSPECTION OF REACTOR VESSEL STUDS AND NUTS BY COMBINED MULTI-FREQUENCY EDDY CURRENT AND ULTRASONIC TECHNIQUE
Index. Index. 1.0 Introduction...2 This Manual Operation Finger Lift Cable Lift Pneumatic Operation...
 Li nearenc oder s wi t httlout put Us ermanual Index 1.0 Introduction..........................2 This Manual...........................2 2.0 Safety Summary......................3 Terms in this Manual....................3
Support Frame STB Technical Instruction Manual
 Support Frame STB Technical Instruction Manual Fig. 2.1: Support frame STB 450 Fig. 2.2: Support frame STB 300 Fig. 2.3: Brace bracket SK 150 Product Characteristics The support frames are mainly used
9 Simulation of Pull Tests for Grouted Cable Anchors
 Simulation of Pull Tests for Grouted Cable Anchors 9-1 9 Simulation of Pull Tests for Grouted Cable Anchors 9.1 Problem Statement The most common method for determination of cable bolt properties is to
1.5mm amplitude at 10 to 55Hz frequency in each X, Y, Z direction for 2 hours 500m/s² (approx. 50G) in each X, Y, Z direction for 3 times
 in each X, Y, Z direction for 3 times") Color Mark Color Mark Feature Outstanding color matching accuracy - RGB light emitting diodes and 12-bit resolution - 2 detection modes (color only / color + intensity) - -step sensitivity adjustment for
Color Mark Color Mark Feature Outstanding color matching accuracy - RGB light emitting diodes and 12-bit resolution - 2 detection modes (color only / color + intensity) - -step sensitivity adjustment for
Operating Instructions
 CNTX Contrast sensor Operating Instructions CAUTIONS AND WARNINGS SET-UP DISTANCE ADJUSTMENT: As a general rule, the sensor should be fixed at a 15 to 20 angle from directly perpendicular to the target
COMPOSITE VIDEO LUMINANCE METER MODEL VLM-40 LUMINANCE MODEL VLM-40 NTSC TECHNICAL INSTRUCTION MANUAL
 COMPOSITE VIDEO METER MODEL VLM- COMPOSITE VIDEO METER MODEL VLM- NTSC TECHNICAL INSTRUCTION MANUAL VLM- NTSC TECHNICAL INSTRUCTION MANUAL INTRODUCTION EASY-TO-USE VIDEO LEVEL METER... SIMULTANEOUS DISPLAY...
WELDING CONTROL UNIT: TE 450 USER MANUAL
 j WELDING CONTROL UNIT: TE 450 USER MANUAL RELEASE SOFTWARE No. 1.50 DOCUMENT NUMBER: MAN 4097 EDITION: MARCH 1998 This page is left blank intentionally. 2 / 34 TABLE OF CONTENTS SUBJECTS PAGE WELDING
Copyright 2008 Society of Manufacturing Engineers. FUNDAMENTALS OF TOOL DESIGN Progressive Die Design
 FUNDAMENTALS OF TOOL DESIGN Progressive Die Design SCENE 1. PD06A, tape FTD29, 09:14:22:00-09:14:48:00 pan, progressive die operation PROGRESSIVE DIES PERFORM A SERIES OF FUNDAMENTAL CUTTING AND FORMING
"CHOOSING A STATIC MIXER"
 "HOW TO CHOOSE A STATIC MIXER TO PROPERLY MIX A 2-COMPONENT ADHESIVE" BY David W. Kirsch Choosing a static mixer requires more than reading a sales catalog and selecting a part number. Adhesive manufacturers
Signal Conditioners. Highlights. Battery powered. Line powered. Multi-purpose. Modular-style. Multi-channel. Charge & impedance converters
 Signal Conditioners Highlights Battery powered Line powered Multi-purpose Modular-style Multi-channel Charge & impedance converters Industrial charge amplifiers & sensor simulators PCB Piezotronics, Inc.
LVDT. Inductive Position Transducer - Hydraulic Series. SM-HYD Hydraulic Series. Key-Features:
 HM 1808 LVDT Inductive Position Transducer - Hydraulic Series SM-HYD Hydraulic Series Key-Features: Content: - Screw flange M18x1,5 / M30x1,5 or plug-in flange Ø18 - Pressure up to 400 bar - Measurement
Practical Application of the Phased-Array Technology with Paint-Brush Evaluation for Seamless-Tube Testing
 ECNDT 2006 - Th.1.1.4 Practical Application of the Phased-Array Technology with Paint-Brush Evaluation for Seamless-Tube Testing R.H. PAWELLETZ, E. EUFRASIO, Vallourec & Mannesmann do Brazil, Belo Horizonte,
MAGNETIC CARD READER DESIGN KIT TECHNICAL SPECIFICATION
 MAGNETIC CARD READER DESIGN KIT TECHNICAL SPECIFICATION Part Number: D99821002 Rev 212 MAY 2017 REGISTERED TO ISO 9001:2008 1710 Apollo Court Seal Beach, CA 90740 Phone: (562) 546-6400 FAX: (562) 546-6301
FUNDAMENTAL MANUFACTURING PROCESSES Computer Numerical Control
 FUNDAMENTAL MANUFACTURING PROCESSES Computer Numerical Control SCENE 1. CG: FBI warning white text centered on black to blue gradient SCENE 2. CG: disclaimer white text centered on black to blue gradient
SIMET AVIKO D INSTRUCTION MANUAL SORTING Solutions, Ltd.
 SIMET AVIKO D INSTRUCTION MANUAL 1870 SORTING Solutions, Ltd. 1. TABLE OF CONTENTS 1. TABLE OF CONTENTS...1 2. INTRODUCTION...2 2.1. Application...2 2.2. Operating Conditions...2 2.3. Electro - Optical
SCALE & WEIGHT DISPLAYS
 The MICRO SERIES SCALE & WEIGHT DISPLAYS LARGE DIGIT MODELS Mighty-5S DPM MODELS Micro-S & Mighty-1S Mighty-1S Micro-S ELECTRO-NUMERICS, INC. Introduction The Electro-Numerics family of Digital Panel Meters
In Chapter 4 on deflection measurement Wöhler's scratch gage measured the bending deflections of a railway wagon axle.
 Cycle Counting In Chapter 5 Pt.2 a memory modelling process was described that follows a stress or strain input service history and resolves individual hysteresis loops. Such a model is the best method
Session 1 Introduction to Data Acquisition and Real-Time Control
 EE-371 CONTROL SYSTEMS LABORATORY Session 1 Introduction to Data Acquisition and Real-Time Control Purpose The objectives of this session are To gain familiarity with the MultiQ3 board and WinCon software.
LAUREL ELECTRONICS, INC.
 LAUREL ELECTRONICS, INC. Laureate Digital Panel Meter for Process, Strain & Potentiometer Follower Signals Features Selectable ±0.2, ±2, ±20, ±200, ±300 & ±600 Vdc voltage ranges Selectable ±2, ±20, ±200
Process Control and Instrumentation Prof. D. Sarkar Department of Chemical Engineering Indian Institute of Technology, Kharagpur
 Process Control and Instrumentation Prof. D. Sarkar Department of Chemical Engineering Indian Institute of Technology, Kharagpur Lecture - 36 General Principles of Measurement Systems (Contd.) (Refer Slide
Materials: Programming Objectives:
 Lessons Lesson 1: Basic Chassis Overview TETRIX Getting Started Guide In this lesson, users will learn how to use the elements of the TETRIX system that will be involved in building the basic chassis of
Up to 85% higher Service Life due to efficient sealing method.
 Robot Accessories Feeding through Up to 85% higher Service Life due to efficient sealing method. 346 Robot Accessories Feeding through Feeding through DDF 2 Rotary Feed-through Series Size Page DDF 2 348
Integration of Virtual Instrumentation into a Compressed Electricity and Electronic Curriculum
 Integration of Virtual Instrumentation into a Compressed Electricity and Electronic Curriculum Arif Sirinterlikci Ohio Northern University Background Ohio Northern University Technological Studies Department
Simulation of Micro Blanking Process of Square Hole with Fillet Based on DEFORM-3D
 3rd International Conference on Material, Mechanical and Manufacturing Engineering (IC3ME 2015) Simulation of Micro Blanking Process of Square Hole with Fillet Based on DEFORM-3D Shining Zhou 1,a, Xiaolong
Application of Measurement Instrumentation (1)
") Slide Nr. 0 of 23 Slides Application of Measurement Instrumentation (1) Slide Nr. 1 of 23 Slides Application of Measurement Instrumentation (2) a. Monitoring of processes and operations 1. Thermometers,
Slide Nr. 0 of 23 Slides Application of Measurement Instrumentation (1) Slide Nr. 1 of 23 Slides Application of Measurement Instrumentation (2) a. Monitoring of processes and operations 1. Thermometers,
Distributed Design Series
 D10SUB 10-INCH FEATURES Powerful, high-impact bass response Internal passive low-pass crossover Spring loaded Drop-Stop installation assistant tabs support the back can on the included rails and C-ring
OPERATING INSTRUCTIONS FOR SYLVANIA. Type I08 Cathode-Ray Oscilloscope. Sylvania Electric Products Inc. Industrial Apparatus. Emporium, Pennsylvania
 OPERATING INSTRUCTIONS FOR SYLVANIA Type I08 Cathode-Ray Oscilloscope Sylvania Electric Products Inc. Industrial Apparatus Plant Emporium, Pennsylvania OPERATING INSTRUCTIONS FOR Sylvania Type 08 Cathode-Ray
3.22 Finalize exact specifications of 3D printed parts.
 3.22 Finalize exact specifications of 3D printed parts. This is the part that connect between the main tube and the phone holder, it needs to be able to - Fit into the main tube perfectly - This part need
THE OPERATION OF A CATHODE RAY TUBE
 THE OPERATION OF A CATHODE RAY TUBE OBJECT: To acquaint the student with the operation of a cathode ray tube, and to study the effect of varying potential differences on accelerated electrons. THEORY:
An Open-Ended Ball-Balancing Laboratory Project for Undergraduates
 An Open-Ended Ball-Balancing Laboratory Project for Undergraduates Evencio A. Rosales, Bennett T. Ito, Katie A. Lilienkamp, and Kent H. Lundberg* Department of Mechanical Engineering *Department of Electrical
ENGINEERING COMMITTEE Interface Practices Subcommittee AMERICAN NATIONAL STANDARD ANSI/SCTE
 ENGINEERING COMMITTEE Interface Practices Subcommittee AMERICAN NATIONAL STANDARD ANSI/SCTE 102 2010 Cable Retention Force Testing of Trunk & Distribution Connectors NOTICE The Society of Cable Telecommunications
LAUREL. Laureate Digital Panel Meter for Load Cell & Microvolt Input ELECTRONICS, INC. Features. Description
 Description LAUREL ELECTRONICS, INC. Features Laureate Digital Panel Meter for Load Cell & Microvolt Input 20, 50, 100, 250 & 500 mv ranges Span adjust from 0 to ±99,999, zero adjust from -99,999 to +99,999
Series SM ø12 mm. Inductive Position Transducer. ranges mm. linearity 0,2/0,3% ø12 mm, clamp-ø8 mm h6. out: AC, V, V, 4...
 LVDT Inductive Position Transducer Series SM ø12 mm ranges 2...200 mm linearity 0,2/0,3% ø12 mm, clamp-ø8 mm h6 out: AC, 0...10 V, 0...5 V, 4...20 ma with external or integrated cable electronics repeatability
Design Guide DSK/DSL
 Page 1 of 16 Original version of the design guide For Components DSK 14.26 DSL 14.26 DSK 30.42 DSL 30.42 DSK 50.75 DSL 50.75 DSK 140.170 DSL 140.170 DSK 14.26 DSL 15.28 DSK 30.47 DSL 30.47 DSK 50.80 DSL
Personal Protective Equipment Wear nitrile gloves, lab coat, and safety glasses as a minimum protection, unless otherwise indicated.
 4pt Bending, Mouse This protocol is for standard Jepsen 4pt bending of adult mouse bone. Safety considerations Please reference the Jepsen laboratory when using this protocol. This protocol is subject
Modifying the RW1127 and similar TWTs for 24GHz
 Modifying the RW1127 and similar TWTs for 24GHz Some notes by Brian G4NNS updated after the EME conference. Issue 1.04 During a visit from Johannes DF1OI he explained how Ulli DK3UC had modified Siemens
Renishaw Ballbar Test - Plot Interpretation - Mills
 Haas Technical Documentation Renishaw Ballbar Test - Plot Interpretation - Mills Scan code to get the latest version of this document Translation Available This document has sample ballbar plots from machines
DDF-SE. Application example. Feed-through Stationary Rotary Feed-through. Max. speed 500 revs/ min. Air feed-through Up to 6x
 DDF-SE www.comoso.com Sizes 080.. 120 Max. speed 500 revs/ min Air feed-through Up to 6x Electrical feed-throughs Up to 8x Application example Turning a component for laser welding or centrifugal drying
Shane Tornifoglio Page 1 of 6. Weekly Report 6 2/29/10
 Shane Tornifoglio Page 1 of 6 Week 1 Feb 22 nd March 1 st This meeting marks the first meeting in three weeks because of no meeting the week before spring break and then bring break itself. The first week
Three Axis Digital Readout System
 NEWALL MEASUREMENT SYSTEMS C80 Three Axis Digital Readout System CONTENTS 2 SPECIFICATIONS 3 CONNECTIONS 4 MOUNTING 4 Arm Mounting (Non-adjustable) 4 Arm Mounting (Adjustable) 5 Face Mounting (Adjustable)
Electrical and Electronic Laboratory Faculty of Engineering Chulalongkorn University. Cathode-Ray Oscilloscope (CRO)
") 2141274 Electrical and Electronic Laboratory Faculty of Engineering Chulalongkorn University Cathode-Ray Oscilloscope (CRO) Objectives You will be able to use an oscilloscope to measure voltage, frequency
2141274 Electrical and Electronic Laboratory Faculty of Engineering Chulalongkorn University Cathode-Ray Oscilloscope (CRO) Objectives You will be able to use an oscilloscope to measure voltage, frequency
TE 86 MULTI-STATION HIP JOINT SIMULATOR
 TE 86 MULTI-STATION HIP JOINT SIMULATOR Introduction The TE 86 Multi-station Hip Joint Simulator is manufactured under licence from Dr Vesa Saikko, Laboratory of Machine Design, Department of Mechanical
BER MEASUREMENT IN THE NOISY CHANNEL
 BER MEASUREMENT IN THE NOISY CHANNEL PREPARATION... 2 overview... 2 the basic system... 3 a more detailed description... 4 theoretical predictions... 5 EXPERIMENT... 6 the ERROR COUNTING UTILITIES module...
Circuits Assembly September 1, 2003 Duck, Allen
 Article from: Circuits Assembly Article date: September 1, 2003 Author: Duck, Allen Depaneling is an overlooked step in surface-mount production and involves the separation of a single piece from its carrier
WEAVE: Web-based Educational Framework for Analysis, Visualization, and Experimentation. Steven M. Lattanzio II 1
 WEAVE: Web-based Educational Framework for Analysis, Visualization, and Experimentation Steven M. Lattanzio II 1 Abstract WEAVE (Web-Based Educational Framework for Analysis, Visualization, and Experimentation)
800 Displaying Series Flowmeter
 TECHNICAL PRODUCT INSTRUCTION SHEET 800 Displaying Series Flowmeter OVERVIEW The principle of operation is very simple. A jet of liquid is directed at a free running Pelton wheel turbine in a specially
Cable Retention Force Testing of Trunk & Distribution Connectors
 ENGINEERING COMMITTEE Interface Practices Subcommittee AMERICAN NATIONAL STANDARD ANSI/SCTE 102 2016 Cable Retention Force Testing of Trunk & Distribution Connectors NOTICE The Society of Cable Telecommunications
General Wiring and Installation Guidelines. Typical Mounting Installations Electrical Connections General Guidelines Common Questions & Answers
 General Wiring and Installation Guidelines Typical Mounting Installations Electrical Connections General Guidelines Common Questions & Answers Congratulations on your purchase of a Dynapar brand encoder.
Technology Overview LTCC
 Sheet Code RFi0604 Technology Overview LTCC Low Temperature Co-fired Ceramic (LTCC) is a multilayer ceramic substrate technology that allows the realisation of multiple embedded passive components (Rs,
VM GATE VALVE GRINDING & LAPPING MACHINE
 VM1150-1200 GATE VALVE GRINDING & LAPPING MACHINE 2014 04 VM1150-1200 Lightweight for easy handling and installation. Powerful Wide working range: nominal diameter of 1.5-48 inches (40-1200 mm). Submersion
TRAN-COR H. grain ORIENTED ELECTRICAL STEELS. Applications Potential. a significant increase in core loss.
 TRAN-COR H grain ORIENTED ELECTRICAL STEELS H-0 CARLITE H-0 CARLITE DR H-1 CARLITE H-1 CARLITE DR H-2 CARLITE H-2 CARLITE DR P r o d u c t D ata B u l l e t i n Applications Potential TRAN-COR H CARLITE
In-Line or 75 Ohm In-Line
 or 5 Ohm 1dB Adjustable Gain 800/1900 Smart Technology Contents: Quick Install Overview.... 2 Installation Diagram.... Understanding the Lights... 9 Warnings and Recommendations....11 Appearance of device
Service manual Cantano W/T
 Service manual Cantano W/T Here you will see everything that should be included in your Cantano package 2 Prerequisite: Placement and leveling of the drive 5 Setting up the motor and connecting it to the
3M Sensored Termination (15 kv) QX-T15I-vi1-E
 QX-T15I-vi1-E") 3M Sensored Termination () QX-T15I-vi1-E Data Sheet May 2016 Kit Contents: Each kit contains sufficient quantities of the following materials to make three single-phase terminations. 31" (REF) One piece
3M Sensored Termination () QX-T15I-vi1-E Data Sheet May 2016 Kit Contents: Each kit contains sufficient quantities of the following materials to make three single-phase terminations. 31" (REF) One piece
Scanning System S-2100
 2D laser measurement system The fastest 2D laser measurement system in the world 119 m range Scan rate >1 million points/sec 360 vertical field of view System description The PENTAX Scanning System S-2100
Fiberglass - Technical Data
 - Technical Data Cable Tray Thermal Contraction and Expansion X : Denotes hold-down clamp (anchor) at support. _ : Denotes expansion guide clamp at support. It is important that thermal contraction and
Sealed Linear Encoders with Single-Field Scanning
 Linear Encoders Angle Encoders Sealed Linear Encoders with Single-Field Scanning Rotary Encoders 3-D Touch Probes Digital Readouts Controls HEIDENHAIN linear encoders are used as position measuring systems
TECHNICAL MANUAL DRAW-WIRE DISPLACEMENT TRANSDUCER TYPE DWT
 RDP Customer Document TECHNICAL MANUAL DRAW-WIRE DISPLACEMENT TRANSDUCER TYPE DWT Doc. Ref CD1004L BS EN ISO 9001 Certificate No. FM13141 Affirmed by Declaration of Conformity USA & Canada RDP Electrosense
PRACTICAL APPLICATION OF THE PHASED-ARRAY TECHNOLOGY WITH PAINT-BRUSH EVALUATION FOR SEAMLESS-TUBE TESTING
 PRACTICAL APPLICATION OF THE PHASED-ARRAY TECHNOLOGY WITH PAINT-BRUSH EVALUATION FOR SEAMLESS-TUBE TESTING R.H. Pawelletz, E. Eufrasio, Vallourec & Mannesmann do Brazil, Belo Horizonte, Brazil; B. M. Bisiaux,
TL-2900 AMMONIA & NITRATE ANALYZER DUAL CHANNEL
 TL-2900 AMMONIA & NITRATE ANALYZER DUAL CHANNEL DATA ACQUISITION SYSTEM V.15.4 INSTRUCTION MANUAL Timberline Instruments, LLC 1880 S. Flatiron Ct., Unit I Boulder, Colorado 80301 Ph: (303) 440-8779 Fx:
A FOUR GAIN READOUT INTEGRATED CIRCUIT : FRIC 96_1
 A FOUR GAIN READOUT INTEGRATED CIRCUIT : FRIC 96_1 J. M. Bussat 1, G. Bohner 1, O. Rossetto 2, D. Dzahini 2, J. Lecoq 1, J. Pouxe 2, J. Colas 1, (1) L. A. P. P. Annecy-le-vieux, France (2) I. S. N. Grenoble,
Cyclo Series. user manual. MartinArchitectural
 Cyclo Series user manual MartinArchitectural Measurements are in millimeters 63 Cyclo 02 88 Cyclo 03 1000 81 1190 88 Cyclo 04 98 88 2002 Martin Professional A/S, Denmark. All rights reserved. No part of
Flat-Bed Module Recorders
 Flat-Bed Module Recorders Model No. 08376-50 08376-55 08376-60 0115-0192 4/28/00 Table of Contents Introduction...3 Power Requirements...3 Chart Paper Installation...3 Pen Installation...5 Grounding...5
Electronic Panel Meters DIGEM Preference Program Process control, automation & laboratory uses Class 0.01 to 1 Current, Voltage, Frequency,
 Electronic Panel Meters DIGEM Preference Program Process control, automation & laboratory uses Class 0.01 to 1 Current, Voltage, Frequency, Temperature, RPM, Pressure, etc. LED/ LCD displays 1999 to 99999
Gigabit Multi-mode SX to Single Mode LX Converter. User s Manual NGF-728 Series. Warning COPYRIGHT
 COPYRIGHT Gigabit Multi-mode SX to Single Mode LX Converter User s Manual NGF-728 Series All rights reserved. No part of this publication may be reproduced, stored in a retrieval system, or transmitted
RST INSTRUMENTS LTD.
 RST INSTRUMENTS LTD. MEMS Tilt Beam Instruction Manual Copyright 2012 Ltd. All Rights Reserved. Ltd. 11545 Kingston St., Maple Ridge, B.C. Canada V2X 0Z5 Tel: (604) 540-1100 Fax: (604) 540-1005 Email: