TR-SES-200 High Resolution VUV/UV Transmission and Reflection Evaluation System Manual
|
|
|
- Bonnie Welch
- 5 years ago
- Views:
Transcription

1 Document RD No: TR-SES-200 High Resolution VUV/UV Transmission and Reflection Evaluation System Manual
2 TR-SES-200 Manual 1 Table of Contents Table of Contents System Overview Packing List Item Overview Quick Setup and Operational Checkout Hardware Setup Testing of Spectrometer Manually Obtaining a Reference Spectrum Subroutines PMT Signal Optimization for Maximum Signal Sample Rotation Optimization Sample Tilt Optimization for Maximum Signal Obtaining an Optimized Reference Spectrum without Automated Scanning Calibration Calibrating the PMT Stage Calibrating the Sample Rotation Calibrating the Sample Tilt Calibrating the Spectrometer Obtaining Transmission/Reflection Measurements Transmission/Reflection Vs. Wavelength using Automated Scanning Transmission/Reflection Vs. Wavelength without using Automated Scanning Transmission/Reflection Vs. PMT Angle Transmission/Reflection Vs. Sample Tilt Cross Sample Transmission/Reflection Measurement System Summary Appendix System Components Hydrogen Light Source Monochromator PMT Stage Order Sorter Sample Wheel Software Example Scans Contact
 to ultraviolet (UV) radiation to a target sample and measure the reflectance, transmission or")
3 TR-SES-200 Manual 2 System Overview The Resonance Ltd. Transmission and Reflection Evaluation System is designed to deliver vacuum-ultraviolet (VUV) to ultraviolet (UV) radiation to a target sample and measure the reflectance, transmission or fluorescence of the target. The system includes a hydrogen lamp emitting from 115 nm to 400 nm, a 200 mm focal length vacuum monochromator with a PC controlled motor drive, a Hamamatsu R8486 photomultiplier tube (PMT) capable of detecting from 115 to 300 nm, Labview TM software and controlling electronics. TR-SES-200 Main System Parts
4 TR-SES-200 Manual 3 Packing List Below is a list of all the components shipped with the TR-SES-200. If you find any of these items to be missing, please contact Resonance Ltd. to arrange to have it delivered. Item Instruction Manual Tr-SES-200 Assembly including: VM200 Monochromator including: 1200G/mm grating WL adjustment electronics and software along with 2.75 inch Vacuum flange on rear can for pumpout High Vacuum certification VUV/UV test spectra Order sorting filters for 100 to 600 range (see TRSO) 2.75 inch Vacuum flanges for slits and pumpout VUV/UV test spectra NIST Traceable calibration VMMDA VM Motorized wavelength drive with PC interface VMSA Adjustable slit assemblies TRApSAperture stop TRSO VM200 Motorized Order-Sorter including vacuum compatible servo motor TRSC Sample Vacuum chamber end flanges pumping and other ports with CF flanges Interfaces to sample and PMT TRPMT-CsTe VUV CsTe PMT including: Hamamatsu R8486 PMT Hamamatsu C6271 Power Supply Socket Cables TRMT-PMT including motorized turntable vacuum rotation assembly high torque motor with position feedback TRMSWA Motorized Sample wheel assembly 10 x 1 inch sample wheel 20 x ½ inch sample wheel TR-SW-CUST CUSTOM MM SAMPLE Wheel TRPM-VUV2.75 Parabolic Mirror Collimator TRIR Iris for adjusting light aperture in vacuum chamber
5 TR-SES-200 Manual 4 TRVID Video Monitor for viewing motion of sample wheel and PMT Toolkit T1 Tools for assembly Hardware Vacuum Gaskets TR-VUV-VLS Lamp system with efficient coupling to VM200 TRPCWE PC with Software installed includes TRSW Software Electronics interface to PMT Sample wheel Iris and VM200 Monitor Samsung SD390HL sn 023WHCPG Keyboard and Mouse TR-SES-200 System Main components 1. Tr-SES-200 main chamber assembly 2. TR-VUV-VLS Lamp system 3. TRPCWE PC PC system, software, monitor keyboard and mouse


6 TR-SES-200 Manual 5 Quick Setup and Operational Checkout Hardware Setup 1. Unpack system 2. Attach the Tr-SES-200 to the pump (either back or bottom 4.5 inch CF can be used). Figure 3: Vacuum hose and elbow 3. Open the sample wheel door Figure 4: System with Sample wheel door open


7 TR-SES-200 Manual 6 4. Carefully remove PMT wheel locking tie 5. Place the sample wheel on the spindle making sure it sits flat by aligning the spindle pin to the alignment hole on the wheel. Tighten the locking nut onto the spindle. Figure 7: Sample wheel placement (shown prior to application of black paint) 6. Close the sample wheel door making sure the vacuum seal o-ring sits flat inside the groove of the door. Fasten the door bolts until there is compression of the o-ring. Figure 8: Vacuum seal O-ring seated in door


8 TR-SES-200 Manual 7 8. Attach the lamp to the entrance slit flange of the monochromator with the screws and viton gasket provided. Tighten the screws until the gasket compresses and the lamp flange is touching the entrance slit flange. 9. Plug in the main electronics box to AC power.


9 TR-SES-200 Manual Plug in the two electronic D style cables and the two plastic connectors to the Main Electronics case and the vacuum chamber. Follow the color code to insure the cables are plugged into the right connectors. Figure 11: Electronics case connectors 11. Plug in PC to AC power. 12. Attach the Camera and LED mount to the side view port by sliding the case on until it clicks in. Plug in the corresponding USB and LED cables to the PC/electronics box. 13. Plug in USB cable between the Display and the PC/Electronics box. 14. Turn PC on by pushing the PC On/Off button on front panel. The PC Power LED on the Main Electronics box should come on (if not check cables) Figure 12: Power indicator LEDs on electronics case

10 TR-SES-200 Manual Turn on system electronics. The Lamp, PMT and Servos green LEDs on the Main Electronics box should come on. Note: The PC may operate independently from the TR-SES-200 system electronics. When not using the transmissometer for an extended period of time it is recommended to turn off the system electronics. Keep in mind the lamp has a warm-up period. 16. Open the VUV Spectrophotometer software by double clicking the TR-SES-200 icon on the desktop. 17. The indicator lights at the top of the screen should glow green after a few seconds. Figure 14: Software system check indicator lights 18. Make sure there is nothing obstructing any of the stages from rotating.

11 TR-SES-200 Manual 10 Testing of Spectrometer 19. Observe that the fan turns on when system electronics is on. Figure 16: Lamp Mounted to VM Allow approximately 20 minutes for the lamp to warm up and stabilize. 21. Meanwhile, carefully close the PMT door and bolt shut until the O-ring compresses. 22. Set aperture to Open Aperture with software. Figure 18: Aperture Wheel (prior to application of black paint)


12 TR-SES-200 Manual Carefully close the sample holder door and bolt shut until the O-ring compresses. 24. Open slits (2) to 800 microns 25. In the program, go to the PMT Rotation tab and set the desired angle to 0 degrees. The PMT rotation motor will make a sound and the displayed PMT angle will start changing. Wait until the PMT reaches zero position. 26. Go to the Sample Rotation tab and set the sample wheel rotation to a vacant sample location. 27. On the Spectrometer tab, set the desired Wavelength to 230nm and press the Scan button in the bottom left corner.
 to an initial low value and increase accordingly to the PMT signal value so as to not saturate the signal.")
13 TR-SES-200 Manual Click the PMT button to turn on the photomultiplier tube (located in the lower right-hand corner of screen). Set the PMT Gain (adjustable via slider or value input box) to an initial low value and increase accordingly to the PMT signal value so as to not saturate the signal. You should observe the numeric value in the PMT Signal box increase while adjusting the PMT gain to get a peak value below the maximum signal. If the PMT is exposed to a large signal while the voltage is set high, there is a possibility of damaging the detector! Figure 20: PMT gain and signal location 29. After the lamp has been running for 20 minutes, scan the spectrum from 170 to 310nm at a resolution of 0.1nm. One should see the UV portion of the D2 lamp spectrum which peaks at 230 nm.
14 TR-SES-200 Manual 13 Manually Obtaining a Reference Spectrum 1. Make sure that all doors to the chamber are closed and that there are no sources of light leakage into the chamber. 2. Go to the Spectrometer tab and set the wavelength to 230 nm. 3. Place the PMT at zero degrees (directly opposite the collimating assembly) 4. Set the PMT gain to a reasonable level (~2V). At this point a signal should be detected. 5. Rotate through 360 degrees on sample wheel to identify the locations of the open sector. 6. Scan to middle of the plateau of a vacant location. Record this angle for future use. 7. Return to the PMT Rotation tab and scan across the peak from -10 to Scan up to the middle of the peak to optimize the signal. 9. Perform a scan across the wavelength range to be used in the tes sequence and save as your reference.
15 TR-SES-200 Manual 14 Subroutines PMT Signal Optimization for Maximum Signal 1. Go to the Spectrometer tab and set the wavelength to 230nm. 2. Go to the Sample Rotation tab and set the sample wheel to a vacant spot for the reference measurement, or to the desired sample location. 3. Scan the PMT from -10 to +10 degrees from the expected angle at a maximum of 0.1 degree increments. Figure 21: Manual scan for PMT alignment
16 TR-SES-200 Manual Take note of the angle where the center of the peak is located. 5. Do another scan with the same step increment, this time ending at the peak of the curve. Figure 22: Optimizing the PMT Signal for maximum signal

17 TR-SES-200 Manual 16 Sample Rotation Optimization 1. Go to the Spectrometer tab and set the wavelength to 230nm. 2. Go to the Sample Angle tab and set the desired angle to 45 degrees. 3. Go to the PMT Rotation tab and perform the PMT Signal Optimization subroutine at zero degrees 4. Go to the Sample Rotation tab and scan across the full 360 degrees at an increment of 0.5 degrees. 5. Take note of the locations of the centers of any signal plateaus. 6. Starting just before the first plateau, scan at 0.1 degree increments to the recorded center of the plateau. 7. Record this as the optimized of the vacant slots for future use. 8. Return to the PMT Rotation tab and perform the PMT signal Optimization subroutine at 90 degrees. 9. Repeat steps 4-7 recording them as the center of the samples for future use.
18 TR-SES-200 Manual 17 Sample Tilt Optimization for Maximum Signal 1. Go to the Spectrometer tab and set the wavelength to 230nm. 2. Go to the Sample Rotation tab and set the sample wheel to the desired sample location. 3. Set the PMT to the desired angle. 4. Scan the Sample Tilt from -10 to +10 degrees from the expected angle at a maximum of 0.1 degree increments. Figure 23: Manual scan for PMT alignment

19 TR-SES-200 Manual Take note of the angle where the center of the peak is located. 6. Do another scan with the same step increment, this time ending at the peak of the curve. Obtaining an Optimized Reference Spectrum without Automated Scanning 1. Perform PMT Signal Optimization subroutine. 2. Perform Sample Rotation Optimization subroutine. Calibration If for some reason you suspect that any of the stages may need re-calibration, simply set the PMT gain to an appropriate level and follow the calibration steps below. Calibrating the PMT Stage 1. Go to the Spectrometer tab and set the wavelength to 230nm. 2. Go to the Sample Rotation tab and set the sample wheel to a vacant spot (such as a reference sample location).
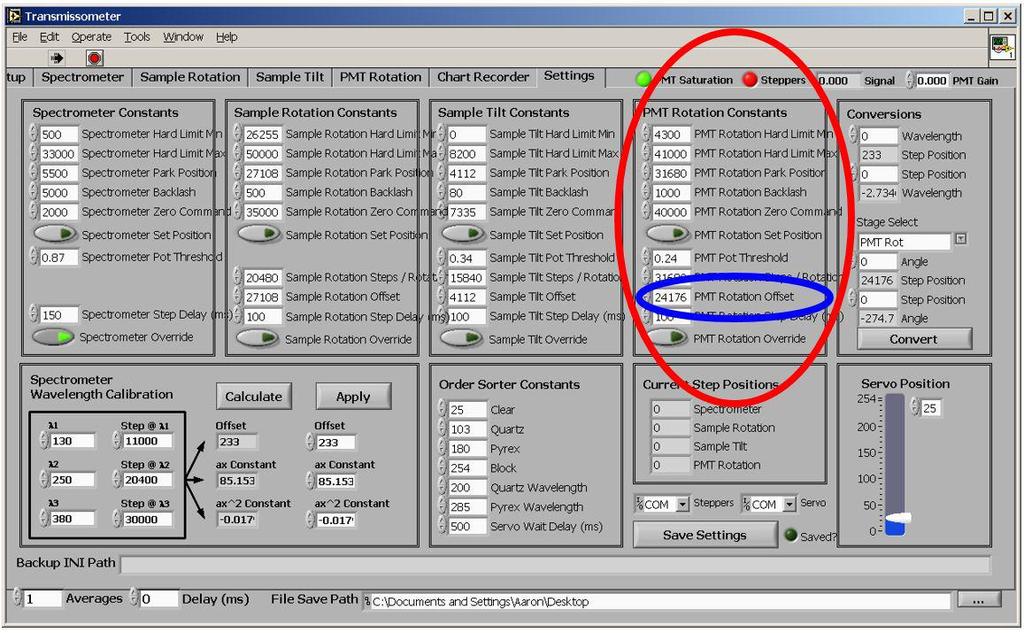
20 TR-SES-200 Manual Scan the PMT from -10 to +10 degrees at a maximum of 0.1 degree increments. 4. Take note of the angle where the center of the peak is located. 5. Go into the Settings tab and in the section labelled Conversions, select PMT Rot in the drop-down box. 6. In the Angle textbox, type in the recorded peak angle from Step 4 and press the Convert button at the bottom of the section. 7. Copy the calculated Step Position in the grey box over to the PMT Rotation Offset textbox in the PMT Rotation Constants section. 8. Press the Save Settings button near the bottom of the screen. The green indicator light should turn on if the file has been properly saved.
21 TR-SES-200 Manual 20
22 TR-SES-200 Manual 21 Calibrating the Sample Rotation 1. Go to the Spectrometer tab and set the wavelength to 230nm. 2. Scan from across the diameter of the desired sample location at a maximum increment of 0.1 degrees. 3. Take note of the angle where the center of the plateau is located. 4. Go into the Settings tab and in the section labelled Conversions, select Sample Rot in the drop-down box. 5. In the Angle textbox, type in the recorded peak angle from Step 3 and press the Convert button at the bottom of the section. 6. Copy the calculated Step Position in the grey box over to the Sample Rotation Offset textbox in the Sample Rotation Constants section. 7. Click the Save Settings button near the bottom of the screen. The green indicator light should turn on if the file has been properly saved.

23 TR-SES-200 Manual 22 Calibrating the Sample Tilt 1. Place a UV reflective mirror on the sample wheel and note its location. 2. Go to the Sample Rotation tab and set it so that the mirror is in the beam path. 3. Go to the Spectrometer tab and set the wavelength to 230nm. 4. Go to the PMT Rotation tab and set the angle to 45 degrees. 5. Scan the angle tilt from at a maximum of 0.1 degree increments. 6. Take note of the angle where the center of the peak is located. 7. Go into the Settings tab and, in the section labelled Conversions, select Sample Tilt in the drop-down box. 8. In the Angle textbox, type in the recorded peak angle from Step 3 and click the Convert button at the bottom of the section and record the calculated step position. 9. Repeat steps 2-6 on the negative side (PMT at -45 and Angle tilt scan from -80 to -100 degrees).
24 TR-SES-200 Manual Calculate the average of the two recorded step positions. This is the location of the zero angle (sample wheel perpendicular to the beam path). 11. Insert the calculated zero angle into the Sample Tilt Offset textbox in the Sample Tilt Constants section. 12. Click the Save Settings button near the bottom of the screen. The green indicator light should turn on if the file has been properly saved. Calibrating the Spectrometer To properly calibrate the spectrometer, at least 3 well defined spectral peaks are required. hydrogen has well known lines at nm. For the second and third line, the second and third order diffraction of the nm line, at nm and nm lines will work. 1. Set the PMT to zero degrees. 2. Set the sample wheel to vacant spot (such as a reference location). 3. Turn on the hydrogen lamp and allow 20 minutes to warm up.
25 TR-SES-200 Manual Pump down the system to the 10-3 mbar range. 5. Perform a full range scan, from 100 to 400nm. 6. Identify the three peaks of interest and take note of their displayed wavelength position. 7. Go to the settings tab and, in the Conversions section, determine their corresponding step positions. 8. In the Spectrometer Wavelength Calibration section, insert what the actual wavelength for the peaks should be in the λ1, λ2 and λ3 textboxes, and the calculated step positions in the corresponding textboxes. 9. Click the Calculate button to obtain a new set of constants. 10. Once satisfied with the constants, click on the Apply button. 11. Click the Save Settings button near the bottom of the screen. The green indicator light should turn on if the file had been properly saved.
26 TR-SES-200 Manual 25 Obtaining Transmission/Reflection Measurements Transmission/Reflection Vs. Wavelength using Automated Scanning 1. Ensure all the stages are properly calibrated. 2. Perform the Sample Rotation Optimization subroutine to determine the location of the samples. 3. Go to the Setup tab. 4. Ensure all the stages have been zeroed. 5. In the Automated Scanning box, select the sample wheel that is being used. 6. Click on the box next to the Sample # for all the samples to be measured. 7. Set the Sample Tilt Angle for the reference and the samples. 8. Set the PMT Angle for the reference and the samples to be measured. 9. Set the Sample Rotation Angle to identify the location of the reference and samples. 10. In the Spectrometer Settings box, set the scan parameters for the measurements: Start and end Wavelength; Wavelength step increment; # of averages per measurement; the delay between readings (only applies if doing more than one averages); and the slit width (for reference only, does not actually set the slit width). 11. Set the PMT Gain to an acceptable level (2.0 is adequate for the majority of situations). 12. In the Signal Selector box, set the input type (PMT Input for standard transmission and reflection measurements, Aux Input for diode sensitivity measurements) and the gain (note: the +/- value indicates the signal limits with that particular gain setting). 13. When all parameters are set, click the Save Parameters button. 14. Click the Measure button to start the scans. The system will go through the scans in the following order: Reference - Sample 1 - Reference - Reference - Sample 2 - Reference... Depending on the settings, this could take from 5 minutes to over and hour.
27 TR-SES-200 Manual Once the scans are complete for each sample the calculated transmission/reflection graph will be displayed (shown as Measure 1, 2 etc. with the scan plots on the right pane along with reference and sample scans). 16. To save, right click the view window and select a desired File Save Path and File Name. You have the option to save all scanned plots or only the current viewed plots. Ensure you select the appropriate option before clearing data or exiting the program. Click Save and your data will be saved to your selected save path. Transmission/Reflection Vs. Wavelength without using Automated Scanning 1. Ensure all the stages are properly calibrated. 2. Perform the Sample Rotation Optimization subroutine to determine the location of the samples. 3. Set the Sample Rotation to the vacant spot for the reference scan. 4. Set the sample tilt to the desired angle. 5. Perform the PMT Optimization subroutine. 6. Go to the Spectrometer tab and set the scan parameters for the measurements : Start and end Wavelength; Wavelength step increment; # of averages per measurement; the delay between readings (only applies if doing more than one averages; and the PMT gain). 7. Select the type of scan to be performed: Constant Rate or Fastest Speed. Fastest speed will go through the scan as quickly as it can under the set parameters, however the time interval between steps may be inconsistent due to software hand-shaking. Constant rate introduces a delay between steps so that the time interval between steps is consistent throughout the scan. 8. When all parameters are set, click the Start Scan button. 9. When the scan is complete, record the Scan # for future calculation.
28 TR-SES-200 Manual Repeat steps 3-9 for each sample to be measured. It is also recommended to take additional reference scans either after each sample or, at the least, after completing all the sample scans to compensate for any potential lamp drift. 11. When ready, set the scan # for the sample transmission/reflection you want to measure as Plot 2 and set two reference scans (either the ones taken at the start and end of the scan sequence or the ones taken immediately before and after the scan for desired sample) as plots 3 and Setup the function setting to calculate the transmission/reflection of the sample using the average of the two reference scans selected. 13. When you re satisfied with the formula setup, click on the Calculate Result button. The displayed graph will automatically change to the calculated transmission/reflection curve. 14. If the curve is very noisy, you can take the average of multiple data points by setting the number of data point to be used in the text box to the right of the Calculate Result button and pressing the Apply Running Average button above it. 15. Set the File Name and the File Save Path. 16. In the drop box beside the Save button select Result then click the Save button. This will save the transmission data as well as all the spectral data used in the calculation. The green indicator light will turn on to indicate that the file has been saved successfully. 17. If external manipulation of the data is desired, set Post 1, 2, 3 and 4 to the desired scan # s and repeat the save process but setting the Save drop box to the Plot number. This will save each scan in its own individual file.
29 TR-SES-200 Manual 28 Transmission/Reflection Vs. PMT Angle 1. Ensure all the stages are properly calibrated. 2. Perform the Sample Rotation Optimization subroutine to determine the location of the samples. 3. Set the Sample Rotation to the vacant spot for the reference scan. 4. Set the sample tilt to the desired angle. 5. Set the monochromator to the desired wavelength. 6. Go to the PMT Rotation tab and set the scan parameters for the measurements : Start and End Angle; Angle step increment; # of averages per measurement; the delay between readings (only applies if doing more than one averages; and the PMT gain). 7. Select the type of scan to be performed: Constant Rate or Fastest Speed. Fastest speed will go through the scan as quickly as it can under the set parameters, however the time interval between steps may be inconsistent due to software hand-shaking. Constant rate introduces a delay between steps so that the time interval between steps is consistent throughout the scan. 8. When all parameters are set, click the Start Scan button. 9. When the scan is complete, record the Scan # for future calculation. 10. Repeat steps 3-9 for each sample to be measured. It is also recommended to take additional reference scans either after each sample or, at the least, after completing all the sample scans to compensate for any potential lamp drift. 11. When ready, set the scan # for the sample who s transmission/reflection you want to measure as Plot 2 and set two reference scans (either the ones taken at the start and end of the scan sequence or the ones taken immediately before and after the scan for desired sample) as plots 3 and Setup the function setting to calculate the transmission/reflection of the sample using the average of the two reference scans selected. 13. When you re satisfied with the formula setup, click on the Calculate Result button. The displayed graph will automatically change to the calculated transmission/reflection curve.
30 TR-SES-200 Manual If the curve is very noisy, you can take the average of multiple data points by setting the number of data point to be used in the text box to the right of the Calculate Result button and click the Apply Running Average button above it. 15. Set the File Name and the File Save Path. 16. In the drop box beside the Save button select Result then click the Save button. This will save the transmission data as well as all the spectral data used in the calculation. The green indicator light will turn on to indicate that the file has been saved successfully. 17. If external manipulation of the data is desired, set Post 1, 2, 3 and 4 to the desired scan # s and repeat the save process but setting the Save drop box to the Plot number. This will save each scan in its own individual file. Transmission/Reflection Vs. Sample Tilt 1. Ensure all the stages are properly calibrated. 2. Perform the Sample Rotation Optimization subroutine to determine the location of the samples. 3. Set the Sample Rotation to the vacant spot for the reference scan. 4. Set the PMT to the desired angle. 5. Set the monochromator to the desired wavelength. 6. Go to the Sample Tilt tab and set the scan parameters for the measurements : Start and End Angle; Angle step increment; # of averages per measurement; the delay between readings (only applies if doing more than one averages; and the PMT gain). 7. Select the type of scan to be performed: Constant Rate or Fastest Speed. Fastest speed will go through the scan as quickly as it can under the set parameters, however the time interval between steps may be inconsistent due to software hand-shaking. Constant rate introduces a delay between steps so that the time interval between steps is consistent throughout the scan. 8. When all parameters are set, click the Start Scan button. 9. When the scan is complete, record the Scan # for future calculation.
31 TR-SES-200 Manual Repeat steps 3-9 for each sample to be measured. It is also recommended to take additional reference scans either after each sample or, at the least, after completing all the sample scans to compensate for any potential lamp drift. 11. When ready, set the scan # for the sample who s transmission/reflection you want to measure as Plot 2 and set two reference scans (either the ones taken at the start and end of the scan sequence or the ones taken immediately before and after the scan for desired sample) as plots 3 and Setup the function setting to calculate the transmission/reflection of the sample using the average of the two reference scans selected. 13. When you re satisfied with the formula setup, click on the Calculate Result button. The displayed graph will automatically change to the calculated transmission/reflection curve. 14. If the curve is very noisy, you can take the average of multiple data points by setting the number of data point to be used in the text box to the right of the Calculate Result button and click the Apply Running Average button above it. 15. Set the filename and the File Save Path. 16. In the drop box beside the Save button select Result then click the Save button. This will save the transmission data as well as all the spectral data used in the calculation. The green indicator light will turn on to indicate that the file has been saved successfully. 17. If external manipulation of the data is desired, set Post 1, 2, 3 and 4 to the desired scan # s and repeat the save process but setting the Save drop box to the Plot number. This will save each scan in its own individual file.
32 TR-SES-200 Manual 31 Cross Sample Transmission/Reflection Measurement 1. Ensure all the stages are properly calibrated. 2. Perform the Sample Rotation Optimization subroutine to determine the location of the ends of the vacant spot and samples. 3. Set the Sample Rotation to the vacant spot for the reference scan. 4. Set the sample tilt to the desired angle. 5. Set the monochromator to the desired wavelength. 6. Perform the PMT Optimization subroutine. 7. Go to the Sample Rotation tab and set the scan parameters for the measurements: Start and End Angle; Angle step increment; # of averages per measurement; the delay between readings (only applies if doing more than one averages; and the PMT gain). 8. Select the type of scan to be performed: Constant Rate or Fastest Speed. Fastest speed will go through the scan as quickly as it can under the set parameters, however the time interval between steps may be inconsistent due to software hand-shaking. Constant rate introduces a delay between steps so that the time interval between steps is consistent throughout the scan. 9. When all parameters are set, click the Start Scan button. 10. When the scan is complete, record the Scan # for future calculation. 11. Repeat steps 3-9 for each sample to be measured. It is also recommended to take additional reference scans either after each sample or, at the least, after completing all the sample scans to compensate for any potential lamp drift. 12. When ready, set the scan # for the sample who s transmission/reflection you want to measure as Plot 2 and set two reference scans (either the ones taken at the start and end of the scan sequence or the ones taken immediately before and after the scan for desired sample) as plots 3 and Setup the function setting to calculate the transmission/reflection of the sample using the average of the two reference scans selected.
33 TR-SES-200 Manual When you re satisfied with the formula setup, click on the Calculate Result button. The displayed graph will automatically change to the calculated transmission/reflection curve. 15. If the curve is very noisy, you can take the average of multiple data points by setting the number of data point to be used in the text box to the right of the Calculate Result button and click the Apply Running Average button above it. 16. Set the filename and the File Save Path. 17. In the drop box beside the Save button select Result then press the Save button. This will save the transmission data as well as all the spectral data used in the calculation. The green indicator light will turn on to indicate that the file has been saved successfully. 18. If external manipulation of the data is desired, set Post 1, 2, 3 and 4 to the desired scan # s and repeat the save process but setting the Save drop box to the Plot number. This will save each scan in its own individual file.
34 TR-SES-200 Manual 33 System Summary The TR-SES-200 is a spectrophotometer that has four main system elements: 1. VUV, UV tuneable light source (TLS) consisting of: a. Hydrogen light source with power module for 100 to 240 V operation b. Motorized VM200 Monochromator with 200 nm and 285 nm order sorter filter switch (for continuous operation from 110 to 400 nm). c. Collimating Assembly 2. Motorized sample wheel that can tilt and rotate: a. Tilt and rotate drive mechanism b. 2 inch and 1 inch sample wheels 3. Rotating Detector: a. PMT plus HV power supply and Amplifier. b. Periscope to increase rotation angle to within 6 degrees of beam. c. Rotating PMT stage with motor drive. 4. Electronics/Computing System: a. Main Electronics for motor control PMT and Diode monitoring Telemetry. b. PC.
35 TR-SES-200 Manual 34 Appendix System Components Hydrogen Light Source The system is provided with a Resonance Ltd. D2ArCM-L hydrogen light source, supplying radiation ranging from 115 nm to 400 nm, with a photon flux of approximately 2 x photons/sec/str. The lamp is mounted adaptor and is located on the entrance slit arm of the monochromator. A separate manual describing lamp operation and specs is provided as support documentation. Monochromator A Resonance VM200 scanning monochromator is supplied to act a The VM200 monochromator contains a concave holographic grating optimized for the 100 to 300 range with the following specifications: No. of lines/mm: 1200 l/mm Size: 40 x 45 mm Coating: Al/MgF2 Spectral range of operation: nm Input Focal length: la : 200 mm Output Focal length:: lb : mm Reciprocal Linear Dispersion: 3.09 nm/mm (123 nm), 3.03 nm/mm (159 nm) 2.88 nm/mm (246 nm) The grating is rotated by a servo motor with an multi-turn absolute encoder. The grating is installed in a bucket and the spectrometer has two long arms at the end of which the entrance and the exit adjustable slits are installed. PMT Stage The TR-SES-200 uses a Hamamatsu R mm, side-on PMT. This PMT is sensitive from 115 to 320 nm with a typical quantum efficiency of 22.5% at 122 nm. It is powered using a Hamamatsu C6271 high voltage power supply socket assembly. A 10-turn potentiometer is mounted on the front plate of the electronics rack to control the high voltage output to the PMT. It is best to keep the control voltage set low and increase it as needed. If the PMT is exposed to a large signal while the voltage is set high, there is a possibility of damaging the detector!
36 TR-SES-200 Manual 35 Order Sorter/Aperture Wheel As higher wavelength ranges are scanned, 2 nd and 3 rd order features can appear, making it difficult to obtain accurate spectral measurements. To prevent this, the system is equipped with order sorter filters which filter out lower wavelengths before their 2 nd order signal is reached. The filters are part of the aperture wheel and are software selectable. Quartz filters (transmission drops off around 180 nm) and Pyrex filters (drops off around 310 nm) to block off lower wavelength light are installed. Sample Wheel The system is provided with wheels to accommodate 1 and 2 diameter samples. Accessories are available for alternate sample sizes. Software The TR-SES-200 uses a LabView 8.2 based executable program that is compatible with Windows XP, Vista and Windows 7 and Windows 8.
37 TR-SES-200 Manual 36 Example Scans Measurement Scans Reference Scans
38 TR-SES-200 Manual 37 Contact Resonance Ltd. stands behind every product we sell. We welcome feedback and encourage any of our customers to contact us with questions, or concerns. Resonance Ltd. 143 Ferndale Drive North Barrie, ON L4N 9V9 Tel: Fax: Web:


39 TR-SES-200 Manual 38 Appendix 1 TR-SES-200 Subassemblies 1 VM200 VM200 W/standard 1200G/mm grating manually interchangeable slit, WL adjustment dial, 2.75 inch Vacuum flanges for slits and pump out, High-Vacuum-certified, VUV/UV test spectra, NIST Traceable calibration 2 VMMDA VM Motorized wavelength drive PC electrical interface, software drivers (PC is separate) 3 VMASA VM Adjustable Slit Assemblies (entrance and exit slits) for VM microns to 5 mm 4 TRApS Aperture Stop (Trims slit height for collimation) 5 TRSO VM200 Motorized Order-Sorter including vacuum compatible servo motor filter arm with 180 and 300 nm cutoff filters for 100 to 600 nm range 6 TRSC Sample vacuum chamber plus end flanges, pumping light and electrical io ports with CF flanges, end doors with interfaces for sample wheels and photomultiplier system 7 TRPMT-CsTe VUV CsTe Photomultiplier System with Hamamatsu R8486 PMT and C6271 Power Supply Socket in PMT rotation assy 8 TRMT-PMT Motorized PMT turntable with 360 degree rotation for control of angle of reflectance from sample surface, including vacuum feedthrough of motion, high torque motor with position feedback. 9 TRMSWA Motorized sample wheel assembly including wheel with 10x 1 inch samples with hole patterns for random sample sizes and holes for standard 25 mm sized samples and wheel with 20 x 1/2 inch with holes for 12-mm samples. Sample wheel spindle with rotation motor drive and Sample tilt arm with tilt motor drive. Two motors allow continuous rotation of sample wheel and continuous tilting 10 TRMRC Motorized sample wheel Tilt system including Vacuum servo motor with position feedback to accurately change the angle of incidence onto samples 11 TR-SW-Cust Custom 7mm, 5mm, 3mm sample wheel with capacity of xxx samples at each size.


40 TR-SES-200 Manual TRPM-VUV2.75 Parabolic Mirror Collimator in 2.75-inch Conflat Flange with Vacuum housing, order sorter housing with vacuum electrical feedthroughs, VUV reflecting parabolic collimator 13 TREI-200 Electronics Interface including 16 bit picoammeter with 4 ranges, programmable HV Power supply for PMT, Power drivers for PMT tilt, sample tilt and sample rotation motors, saftey interlock controls for chamber A to D and D to A converters with PC interface 14 TRSW Software for Transmissometer System Control and Acquisition including reflection and transmission spectra, reference spectra, dark subtract, phase sensitive detection, signals vs. angles and signal vs sample positon, export to CSV, Excel, real time monitoring 15 TRPCWE PC with software installed and tested 16 TRVid Video monitor, with and vacuum viewport for checking position of sample wheel and PMT 17 TR-VUVUV-CLS VUV/UV Lamp system with efficient coupling to VM200 with spectral range of 113 to 400 nm, modulation and sync outputs for phase sensitive detection 18 TRSYSCAL System calibration and documentation package for transmission and reflectance of test samples in 113 to 300 nm region
Contents. 1. System Description 3. Overview 3 Part Names 3 Operating Conditions 7 Start-up Procedure 7. 2.
 Rigel 1550 Terahertz Spectrometer User Manual Contents info@tetechs.com 1. System Description 3 Overview 3 Part Names 3 Operating Conditions 7 Start-up Procedure 7 2. Safety 9 Laser Safety 9 Electrical
Standard Operating Procedure of nanoir2-s
 Standard Operating Procedure of nanoir2-s The Anasys nanoir2 system is the AFM-based nanoscale infrared (IR) spectrometer, which has a patented technique based on photothermal induced resonance (PTIR),
OPTICAL POWER METER WITH SMART DETECTOR HEAD
 OPTICAL POWER METER WITH SMART DETECTOR HEAD Features Fast response (over 1000 readouts/s) Wavelengths: 440 to 900 nm for visible (VIS) and 800 to 1700 nm for infrared (IR) NIST traceable Built-in attenuator
111 Highland Drive Putnam, CT USA PHONE (860) FAX (860) SM32Pro SDK
 FAX (860) SM32Pro SDK") SM32Pro SDK Spectrometer Operating -Software Development Kit- USER MANUAL For USB 2.0 Multi-channel User Only Table of Contents Warranty and Liability...3 Location of the SDK source code for USB 2.0...4
SM32Pro SDK Spectrometer Operating -Software Development Kit- USER MANUAL For USB 2.0 Multi-channel User Only Table of Contents Warranty and Liability...3 Location of the SDK source code for USB 2.0...4
Comparison of SONY ILX511B CCD and Hamamatsu S10420 BT-CCD for VIS Spectroscopy
 Comparison of SONY ILX511B CCD and Hamamatsu S10420 BT-CCD for VIS Spectroscopy Technical Note Thomas Rasmussen VP Business Development, Sales, and Marketing Publication Version: March 16 th, 2013-1 -
TracQ Basic. Spectroscopy Software v6.5. User's Manual
 S TracQ Basic Spectroscopy Software v6.5 User's Manual Family of Brands ILX Lightwave New Focus Ophir Corion Richardson Gratings Spectra-Physics MTRACQBASIC6.5, Rev B 2 TABLE OF CONTENTS 1 SAFETY INFORMATION...
TL-2900 AMMONIA & NITRATE ANALYZER DUAL CHANNEL
 TL-2900 AMMONIA & NITRATE ANALYZER DUAL CHANNEL DATA ACQUISITION SYSTEM V.15.4 INSTRUCTION MANUAL Timberline Instruments, LLC 1880 S. Flatiron Ct., Unit I Boulder, Colorado 80301 Ph: (303) 440-8779 Fx:
INSTALATION PROCEDURE
 INSTALLATION PROCEDURE Overview The most difficult part of an installation is in knowing where to start and the most important part is starting in the proper start. There are a few very important items
PHGN 480 Laser Physics Lab 4: HeNe resonator mode properties 1. Observation of higher-order modes:
 PHGN 480 Laser Physics Lab 4: HeNe resonator mode properties Due Thursday, 2 Nov 2017 For this lab, you will explore the properties of the working HeNe laser. 1. Observation of higher-order modes: Realign
Manual placement system MPL3100. for BGA, CSP and Fine-Pitch components
 Manual placement system MPL3100 for BGA, CSP and Fine-Pitch components Part No: MPL3100BA1.0e Issue Date: 02/2001 You have opted for an ESSEMTEC MPL3100 pick and place system. We thank you for this decision
Release Notes for LAS AF version 1.8.0
 October 1 st, 2007 Release Notes for LAS AF version 1.8.0 1. General Information A new structure of the online help is being implemented. The focus is on the description of the dialogs of the LAS AF. Configuration
Mini-spectrometers. TM series. High sensitivity type (integrated with backthinned type CCD image sensor) C10082CA/C10083CA series
 C10082CA/C10083CA series") C12CA/C1CA series type (integrated with backthinned type CCD ) mini-spectrometers are polychromators integrated with optical elements, an and a driver circuit. Light to be measured is guided into the entrance
C12CA/C1CA series type (integrated with backthinned type CCD ) mini-spectrometers are polychromators integrated with optical elements, an and a driver circuit. Light to be measured is guided into the entrance
Silicon PhotoMultiplier Kits
 Silicon PhotoMultiplier Kits Silicon PhotoMultipliers (SiPM) consist of a high density (up to ~ 10 3 /mm 2 ) matrix of photodiodes with a common output. Each diode is operated in a limited Geiger- Müller
ISOMET. Compensation look-up-table (LUT) and How to Generate. Isomet: Contents:
 and How to Generate. Isomet: Contents:") Compensation look-up-table (LUT) and How to Generate Contents: Description Background theory Basic LUT pg 2 Creating a LUT pg 3 Using the LUT pg 7 Comment pg 9 The compensation look-up-table (LUT) contains
Compensation look-up-table (LUT) and How to Generate Contents: Description Background theory Basic LUT pg 2 Creating a LUT pg 3 Using the LUT pg 7 Comment pg 9 The compensation look-up-table (LUT) contains
Displays Open Frame Monitor Model Number: AND-TFT-150Bxx
 Displays 15.0 Open Frame Monitor Model Number: AND-TFT-150Bxx The AND-TFT-150Bxx 15.0 Open Frame Monitor series are rugged, high performance Industrial LCD Monitors, designed for commercial and industrial
Up to 85% higher Service Life due to efficient sealing method.
 Robot Accessories Feeding through Up to 85% higher Service Life due to efficient sealing method. 346 Robot Accessories Feeding through Feeding through DDF 2 Rotary Feed-through Series Size Page DDF 2 348
Agilent 86120B, 86120C, 86122A Multi-Wavelength Meters Technical Specifications
 Agilent 86120B, 86120C, 86122A Multi-Wavelength Meters Technical Specifications March 2006 Agilent multi-wavelength meters are Michelson interferometer-based instruments that measure wavelength and optical
PRODUCT GUIDE CEL5500 LIGHT ENGINE. World Leader in DLP Light Exploration. A TyRex Technology Family Company
 A TyRex Technology Family Company CEL5500 LIGHT ENGINE PRODUCT GUIDE World Leader in DLP Light Exploration Digital Light Innovations (512) 617-4700 dlinnovations.com CEL5500 Light Engine The CEL5500 Compact
COMPOSITE VIDEO LUMINANCE METER MODEL VLM-40 LUMINANCE MODEL VLM-40 NTSC TECHNICAL INSTRUCTION MANUAL
 COMPOSITE VIDEO METER MODEL VLM- COMPOSITE VIDEO METER MODEL VLM- NTSC TECHNICAL INSTRUCTION MANUAL VLM- NTSC TECHNICAL INSTRUCTION MANUAL INTRODUCTION EASY-TO-USE VIDEO LEVEL METER... SIMULTANEOUS DISPLAY...
PHI 5000 VersaProbe TM Operator s Guide
 PHI 5000 VersaProbe TM Operator s Guide Part No. 705921 Rev. A Copyright 2006 ULVAC-PHI, INC. 370 Enzo, Chigasaki, JAPAN The PHI logo ( ) is a registered trademark of ULVAC-PHI, INC. Physical Electronics,
READ THIS FIRST. Morphologi G3. Quick Start Guide. MAN0412 Issue1.1
 READ THIS FIRST Morphologi G3 Quick Start Guide MAN0412 Issue1.1 Malvern Instruments Ltd. 2008 Malvern Instruments makes every effort to ensure that this document is correct. However, due to Malvern Instruments
Stark Spectroscopy Deanna s Experimental Procedure NWU Hupp Lab Fall 2003
 Stark Spectroscopy Deanna s Experimental Procedure NWU Hupp Lab Fall 2003 1. Generate mixed-valent state of compound check in 1mm cell. Ideally want Abs 1. 2. Setting up the instrument New Dewar i) Approx.
Appendix B: An Automated Spectroscope
 239 Appendix B: An Automated Spectroscope B.1: Basic Requirements The accurate measurement of weak emission line intensities places certain requirements on the measuring system: The system must be sensitive,
Figure 1. MFP-3D software tray
 Asylum MFP-3D AFM SOP January 2017 Purpose of this Instrument: To obtain 3D surface topography at sub-nanometer scale resolution, measure contact and friction forces between surfaces in contact, measure
4.9 BEAM BLANKING AND PULSING OPTIONS
 4.9 BEAM BLANKING AND PULSING OPTIONS Beam Blanker BNC DESCRIPTION OF BLANKER CONTROLS Beam Blanker assembly Electron Gun Controls Blanker BNC: An input BNC on one of the 1⅓ CF flanges on the Flange Multiplexer
K Service Source. Apple High-Res Monochrome Monitor
 K Service Source Apple High-Res Monochrome Monitor K Service Source Specifications Apple High-Resolution Monochrome Monitor Specifications Characteristics - 1 Characteristics Picture Tube 12-in. diagonal
Mini-spectrometer. TG series. For near IR, integrating optical system, image sensor and circuit. C9406GC, C9913GC, C9914GB
 , C9913GC, For near IR, integrating optical system, and circuit HAMAMATSU mini-spectrometers are polychromators integrated with optical elements and an. Light to be measured is guided into the entrance
Gigabit Multi-mode SX to Single Mode LX Converter. User s Manual NGF-728 Series. Warning COPYRIGHT
 COPYRIGHT Gigabit Multi-mode SX to Single Mode LX Converter User s Manual NGF-728 Series All rights reserved. No part of this publication may be reproduced, stored in a retrieval system, or transmitted
Technical Procedure for Scanning Electron Microscope/ Energy Dispersive X-Ray System (SEM/EDX) for non-gsr Casework
 for non-gsr Casework") Technical Procedure for Scanning Electron Microscope/ Energy Dispersive X-Ray System (SEM/EDX) for non-gsr Casework 1.0 Purpose This technical procedure shall be followed for the operation of the Scanning
Technical Procedure for Scanning Electron Microscope/ Energy Dispersive X-Ray System (SEM/EDX) for non-gsr Casework 1.0 Purpose This technical procedure shall be followed for the operation of the Scanning
TracQ Basic. Spectroscopy Software v6.6. User's Manual
 S TracQ Basic Spectroscopy Software v6.6 User's Manual Family of Brands ILX Lightwave New Focus Ophir Corion Richardson Gratings Spectra-Physics MTRACQBASIC6.6, Rev B 2 TABLE OF CONTENTS 1 SAFETY INFORMATION...
 Register your product and get support at www.philips.com/welcome SWW1890 User manual Contents 1 Important 4 Safety 4 English 2 Your Philips Wireless HD Net Connect 5 What is in the box 5 3 Overview 6
03-Durchfuehren_RZ_0708_EN.qxd:03-Durchfuehren GB.qxd :06 Uhr Seite 200 Feed-through
 Feed-through Feed-through FEED-THROUGH Series Size Page Rotary Feed-through for Robots DDF 202 DDF 031 206 DDF 040 208 DDF 040-1 210 DDF 050 212 DDF 050-1 214 DDF 063 216 DDF 080 218 DDF 080-1 220 DDF
HV/PHA Adjustment (PB) Part
 Part") HV/PHA Adjustment (PB) Part Contents Contents 1. How to set Part conditions...1 1.1 Setting conditions... 1 2. HV/PHA adjustment sequence...7 3. How to use this Part...9 HV/PHA Adjustment (PB) Part i
HV/PHA Adjustment (PB) Part Contents Contents 1. How to set Part conditions...1 1.1 Setting conditions... 1 2. HV/PHA adjustment sequence...7 3. How to use this Part...9 HV/PHA Adjustment (PB) Part i
721N Spectrophotometer. Operating Manual
 721N Spectrophotometer Operating Manual TABLE OF CONTENTS 1. APPLICATIONS AND FEATURES... 3 2. SPECIFICATIONS AND STANDARD ACCESSORIES... 4 3. PRODUCT APPEARANCE AND FUNCTION KEYS... 6 4. INSTALLATION...
Cover Page for Lab Report Group Portion. Boundary Layer Measurements
 Cover Page for Lab Report Group Portion Boundary Layer Measurements Prepared by Professor J. M. Cimbala, Penn State University Latest revision: 23 February 2017 Name 1: Name 2: Name 3: [Name 4: ] Date:
FLAT DISPLAY TECHNOLOGY
 15.0 Open Frame Monitor Model Number: LOF1506xx This product is RoHS compliant SPEC No.: SAS-1008002 Version: 0.0 Issue Date: September 6, 2010 1. Introduction: 1.1 About the Product The LOF1506xx 15.0
Scanning Electron Microscopy (FEI Versa 3D Dual Beam)
") Scanning Electron Microscopy (FEI Versa 3D Dual Beam) This operating procedure intends to provide guidance for basic measurements on a standard sample with FEI Versa 3D SEM. For more advanced techniques
Scanning Electron Microscopy (FEI Versa 3D Dual Beam) This operating procedure intends to provide guidance for basic measurements on a standard sample with FEI Versa 3D SEM. For more advanced techniques
GFT Channel Digital Delay Generator
 Features 20 independent delay Channels 100 ps resolution 25 ps rms jitter 10 second range Output pulse up to 6 V/50 Ω Independent trigger for every channel Fours Triggers Three are repetitive from three
What is a Fagor Turnkey Package?
 What is a Fagor Turnkey Package? A Turnkey Package is a pre-engineered CNC-Servo System. The CNC is integrated into a functional machine tool pendant and the Servo System is engineered into an electrical
Model DT-311J. And DT-311J-230V(AC) DIGITAL STROBOSCOPE INSTRUCTION MANUAL
 DIGITAL STROBOSCOPE INSTRUCTION MANUAL") Test Equipment Depot - 800.517.8431-99 Washington Street Melrose, MA 02176 - TestEquipmentDepot.com Model DT-311J And DT-311J-230V(AC) DIGITAL STROBOSCOPE INSTRUCTION MANUAL 1. GENERAL The DT-311J DIGITAL
Test Equipment Depot - 800.517.8431-99 Washington Street Melrose, MA 02176 - TestEquipmentDepot.com Model DT-311J And DT-311J-230V(AC) DIGITAL STROBOSCOPE INSTRUCTION MANUAL 1. GENERAL The DT-311J DIGITAL
USER MANUAL. GOLDMUND LOGOS 1N-2N SPEAKER SYSTEM Active Speaker
 USER MANUAL GOLDMUND LOGOS 1N-2N SPEAKER SYSTEM Active Speaker Thank you for purchasing the Goldmund LOGOS 1N-2N SPEAKER SYSTEM The Goldmund Logos line fully incorporates the technological expertise developed
Measurement of Microdisplays at NPL
 Conference on Microdisplays Measurement of Microdisplays at NPL Christine Wall, Dr Julie Taylor, Colin Campbell 14 th Sept 2001 Overview Displays measurement at NPL Why measure microdisplays? Measurement
FREQUENCY CONVERTER 1/3 RACK-MOUNTED BLOCK CONVERTER. Narda-MITEQ FEATURES OPTIONS. Unit shown with Option 17. Unit shown without Option 17
 1/3 RACK-MOUNTED BLOCK CONVERTER Unit shown with Option 17 Unit shown without Option 17 FEATURES Automatic 5/10 MHz internal/external reference selection with a 0.1 Hz nominal bandwidth clean-up loop Gain
E X P E R I M E N T 1
 E X P E R I M E N T 1 Getting to Know Data Studio Produced by the Physics Staff at Collin College Copyright Collin College Physics Department. All Rights Reserved. University Physics, Exp 1: Getting to
Capstone Experiment Setups & Procedures PHYS 1111L/2211L
 Capstone Experiment Setups & Procedures PHYS 1111L/2211L Picket Fence 1. Plug the photogate into port 1 of DIGITAL INPUTS on the 850 interface box. Setup icon. the 850 box. Click on the port 1 plug in
6.4 Chassis Monitor Model Number: LCM0642xx. SPEC No.: SAS Version: 0.0 Issue Date: April 16, Introduction:
 6.4 Chassis Monitor Model Number: LCM0642xx This product is RoHS compliant SPEC No.: SAS-0908003 Version: 0.0 Issue Date: April 16, 2010 1. Introduction: 1.1 About the Product The LCM0642xx 6.4 Chassis
PLL1920M LED LCD Monitor
 PLL1920M LED LCD Monitor USER'S GUIDE www.planar.com Content Operation Instructions...1 Safety Precautions...2 First Setup...3 Front View of the Product...4 Rear View of the Product...5 Installation...6
Connection for filtered air
 BeamWatch Non-contact, Focus Spot Size and Position monitor for high power YAG, Diode and Fiber lasers Instantly measure focus spot size Dynamically measure focal plane location during start-up From 1kW
Advanced Test Equipment Rentals ATEC (2832)
") E stablished 1981 Advanced Test Equipment Rentals www.atecorp.com 800-404-ATEC (2832) Technical Datasheet Scalar Network Analyzer Model 8003-10 MHz to 40 GHz The Giga-tronics Model 8003 Precision Scalar
E stablished 1981 Advanced Test Equipment Rentals www.atecorp.com 800-404-ATEC (2832) Technical Datasheet Scalar Network Analyzer Model 8003-10 MHz to 40 GHz The Giga-tronics Model 8003 Precision Scalar
PLL2210MW LED Monitor
 PLL2210MW LED Monitor USER'S GUIDE www.planar.com Content Operation Instructions...1 Safety Precautions...2 First Setup...3 Front View of the Product...4 Rear View of the Product...5 Quick Installation...6
K Service Source. Apple High-Res Monochrome Monitor
 K Service Source Apple High-Res Monochrome Monitor K Service Source Specifications Apple High-Resolution Monochrome Monitor Specifications Characteristics - 1 Characteristics Picture Tube 12-in. diagonal
PL2410W LCD Monitor USER'S GUIDE.
 PL2410W LCD Monitor USER'S GUIDE www.planar.com Content Operation Instructions...1 Safety Precautions...2 First Setup...3 Front View of the Product...4 Rear View of the Product...5 Quick Installation...6
Flat-Bed Module Recorders
 Flat-Bed Module Recorders Model No. 08376-50 08376-55 08376-60 0115-0192 4/28/00 Table of Contents Introduction...3 Power Requirements...3 Chart Paper Installation...3 Pen Installation...5 Grounding...5
1.2 Universiti Teknologi Brunei (UTB) reserves the right to award the tender in part or in full.
 reserves the right to award the tender in part or in full.") TENDER SPECIFICATIONS FOR THE SUPPLY, DELIVERY, INSTALLATION AND COMMISSIONING OF ONE UNIT OF VARIABLE PRESSURE ENVIRONMENTAL SCANNING ELECTRON MICROSCOPE (SEM) CUM ENERGY DISPERSIVE SPECTROSCOPY (EDS)
TENDER SPECIFICATIONS FOR THE SUPPLY, DELIVERY, INSTALLATION AND COMMISSIONING OF ONE UNIT OF VARIABLE PRESSURE ENVIRONMENTAL SCANNING ELECTRON MICROSCOPE (SEM) CUM ENERGY DISPERSIVE SPECTROSCOPY (EDS)
Scanning System S-2100
 2D laser measurement system The fastest 2D laser measurement system in the world 119 m range Scan rate >1 million points/sec 360 vertical field of view System description The PENTAX Scanning System S-2100
Operating Instructions F900. Fluorescence Spectrometer Software. Issue 1, March 2004
 Operating Instructions F900 Fluorescence Spectrometer Software Issue 1, March 2004 Edinburgh Instruments Ltd., 2 Bain Square, Kirkton Campus, Livingston, EH54 7DQ. UK T: +44 (0)1506 425300 - F: +44 (0)1506
SJOF-BS604B. Fiber Optic Splice Closure User Manual Rev.1
 Fiber Optic Splice Closure 1. Introduction 1.1 General SAMJIN s SJOF-BS604B protects fiber optic splicing point in various installation conditions such as aerial, manholes, ducts, wall and direct buried
CTP10 KEY FEATURES SPEC SHEET COMPONENT TEST PLATFORM
 COMPONENT TEST PLATFORM Efficiently test passive components in 24/7 operation. Perform single sweep insertion loss and return loss measurements with unprecedented dynamic range, speed and resolution. SPEC
Mini-spectrometers. TG series. High sensitivity type (integrated with backthinned type CCD image sensor) Optical characteristics
 Optical characteristics") H High sensitivity type (integrated with backthinned type ) mini-spectrometers are polychromators integrated with optical elements, an and a driver circuit. Light to be measured is guided into the entrance
H High sensitivity type (integrated with backthinned type ) mini-spectrometers are polychromators integrated with optical elements, an and a driver circuit. Light to be measured is guided into the entrance
Agilent 83437A Broadband Light Source Agilent 83438A Erbium ASE Source
 Agilent 83437A Agilent 83438A Erbium ASE Source Product Overview H Incoherent light sources for single-mode component and sub-system characterization The Technology 2 The Agilent Technologies 83437A (BBLS)
SLS-50 Stabilized Laser Source. User s Manual. Shineway Technologies, Inc. All rights reserved.
 SLS-50 Stabilized Laser Source User s Manual Shineway Technologies, Inc. All rights reserved. Safety Instructions The WARNING sign denotes a hazard. It calls attention to a procedure, practice, or the
Laser Beam Analyser Laser Diagnos c System. If you can measure it, you can control it!
 Laser Beam Analyser Laser Diagnos c System If you can measure it, you can control it! Introduc on to Laser Beam Analysis In industrial -, medical - and laboratory applications using CO 2 and YAG lasers,
Mini-spectrometers. RC series. Compact and low cost C11009MA, C11010MA: for installation into measurement equipment.
 Compact and low cost, : for installation into measurement equipment HAMAMATSU mini-spectrometer is a family of compact polychromators integrated with a reflection grating and a CMOS linear. Two types are
SC24 Magnetic Field Cancelling System
 SPICER CONSULTING SYSTEM SC24 SC24 Magnetic Field Cancelling System Makes the ambient magnetic field OK for the electron microscope Adapts to field changes within 100 µs Touch screen intelligent user interface
HRXRD Analysis of Epitaxial Thin Films
 HRXRD Analysis of Epitaxial Thin Films on the Rigaku Smartlab Multipurpose Diffractometer Scott A Speakman, Ph.D Center for Materials Science and Engineering at MIT For assistance in the X-ray lab, contact
Cathode Studies at FLASH: CW and Pulsed QE measurements
 Cathode Studies at FLASH: CW and Pulsed QE measurements L. Monaco, D. Sertore, P. Michelato S. Lederer, S. Schreiber Work supported by the European Community (contract number RII3-CT-2004-506008) 1/27
Series 1100 ColorTS Servo Manual Registration System
 Series 1100 ColorTS Servo Manual Registration System 400 Oser Avenue Hauppauge NY 11788 631 434 3700 phone 631 434 3718 fax www.empregister.com December 14, 2005 TABLE OF CONTENTS TABLE OF CONTENTS...
G.R.A.S. Sound & Vibration
 Instruction Manual Single-channel Low-noise Measuring System consisting of: ½-inch Low-noise Level Microphone System Type 40HH and Power Module Type 12HF 40HH 12HF G.R.A.S. Sound & Vibration Skovlytoften
USB Smart Power Sensor
 50Ω -30 dbm to +20 dbm, 1 MHz to 8000 MHz The Big Deal Fast measurement speed, 10 msec USB HID device compatible with 32/64 Bit operating systems Includes Measurement Application GUI (Graphical User Interface)
AUDIO ROOF KIT P/N , , APPLICATION BEFORE YOU BEGIN KIT CONTENTS. Instr Rev Page 1 of 6
 AUDIO ROOF KIT P/N 2882064, 2882065, 2882066 APPLICATION Verify accessory fitment at Polaris.com. BEFORE YOU BEGIN Read these instructions and check to be sure all parts and tools are accounted for. Please
Assembling and Mounting the Presentation Display, Speakers, Speaker Screens, and Table Door
 CHAPTER 8 Assembling and Mounting the Presentation Display, Speakers, Speaker Screens, and Table Door July 13, 2012, This document provides you with the procedures you perform to assemble and mount the
R-1580A Microwave Downconverter. Product Brochure
 R-1580A Microwave Downconverter Product Brochure Jan 2018 Highlights The DSII Model R-1580A Microwave Downconverter extends the coverage of the R-1550A, or other DSII wide range receivers, to 22 GHz. The
Materials: Programming Objectives:
 Lessons Lesson 1: Basic Chassis Overview TETRIX Getting Started Guide In this lesson, users will learn how to use the elements of the TETRIX system that will be involved in building the basic chassis of
Kratos AXIS Ultra DLD X-ray Photoelectron Spectrometer Instructions
 Kratos AXIS Ultra DLD X-ray Photoelectron Spectrometer Instructions Note: Enter your complete name, CMRF user code, and date into the record book. You must have previously filled out a project information
1.8 METER SERIES 1183 Az/El MOUNT ANTENNA SYSTEM
 REVISION G January 11, 2002 ASSEMBLY MANUAL 1.8 METER SERIES 1183 Az/El MOUNT ANTENNA SYSTEM PRODELIN CORPORATION 1500 Prodelin Drive Newton NC 28658 1.8 METER SERIES 1183 Az/El MOUNT ANTENNA SYSTEM G
SC24 Magnetic Field Cancelling System
 SPICER CONSULTING SYSTEM SC24 SC24 Magnetic Field Cancelling System Makes the ambient magnetic field OK for the electron microscope Adapts to field changes within 100 µs Touch screen intelligent user interface
DH5e-V2. Delta 5 On-Camera 4K HDMI Monitor with 3D LUTs. Quick Start Guide. What s Included
 DH5e-V2 Quick Start Guide Delta 5 On-Camera 4K Monitor with 3D LUTs What s Included 1 x DH5e-V2 Monitor 1 x L Series Battery Plate 1 x AC Adapter 1 x Screen Cleaning Wipe 1 x Screen Protection Film 1 x
SPECIAL SPECIFICATION 6911 Fiber Optic Video Data Transmission Equipment
 2004 Specifications CSJ 3256-02-079 & 3256-03-082 SPECIAL SPECIFICATION 6911 Fiber Optic Video Data Transmission Equipment 1. Description. Furnish and install Fiber Optic Video Data Transmission Equipment
DURATECH FINISH ANALYZER
 DURATECH FINISH ANALYZER MIDAC M2000 FTIR UPGRADE MANUAL This manual contains additional information concerning the extraction unit settings, not found in the extraction unit hardware manual. Please read
USER GUIDE FOR NETmc MARINE X-Ops
 USER GUIDE FOR NETmc MARINE X-Ops Rev.2.2 Firmware v.1.2.8 X-Ops, 1.2.9 Pipeline September 2013 NETmc Marine X-Ops Manual-Rev.2.2 September 2013 1 of 17 Contents 1. Introduction... 3 1.1 Multi-channel
Agilent Agilent 86120B, 86120C, 86122A Multi-Wavelength Meters Data Sheet
 Agilent Agilent 86120B, 86120C, 86122A Multi-Wavelength Meters Data Sheet Agilent multi-wavelength meters are Michelson interferometer-based instruments that measure wavelength and optical power of laser
Data Collection Using APEX3. March 30, Chemical Crystallography Laboratory
 Data Collection Using APEX3 Page 1 of 10 Data Collection Using APEX3 March 30, 2017 Chemical Crystallography Laboratory Author: Douglas R. Powell Data Collection Using APEX3 Page 2 of 10 Distribution Douglas
1.0 ThermoNicolet Nexus 670 FTIR Spectrometer Instructions
 1.0 ThermoNicolet Nexus 670 FTIR Spectrometer Instructions 1.1 Click on the OMNIC icon to open the software. 1.2 Check that a signal is being measured by opening the Experiment Setup menu under the Collect
Operating Manual. Automated Gear. Apollo Design Technology, Inc Fourier Drive Fort Wayne, IN USA
 Operating Manual Automated Gear Apollo Design Technology, Inc. 4130 Fourier Drive Fort Wayne, IN 46818 USA PH: +01(260)497-9191 FX: +01(260)497-9192 www.apollodesign.net 11-25-09 5-6 POWERING UP THE RIGHT
KRAMER ELECTRONICS LTD. USER MANUAL MODEL: RTBUS-12 Round Table Connection Bus. P/N: Rev 1
 KRAMER ELECTRONICS LTD. USER MANUAL MODEL: RTBUS-12 Round Table Connection Bus P/N: 2900-300099 Rev 1 Contents 1 Introduction 1 2 Getting Started 2 2.1 Achieving the Best Performance 2 3 Overview 3 3.1
SPATIAL LIGHT MODULATORS
 SPATIAL LIGHT MODULATORS Reflective XY Series Phase and Amplitude 512x512 A spatial light modulator (SLM) is an electrically programmable device that modulates light according to a fixed spatial (pixel)
Lensed Fibers & Tapered Ends Description:
 Lensed Fibers & Tapered Ends Description: LaseOptics Corporation ( LaseOptics ) has been producing next generation optical lensed fibers. LaseOptics Lensed Optical Fibers technology is proprietary integrated
PXL2760MW LED LCD Monitor
 PXL2760MW LED LCD Monitor USER'S GUIDE www.planar.com Content Operation Instructions...1 Safety Precautions...2 Package Overview...3 First Setup...4 Front View of the Product...5 Rear View of the Product...6
Mini Micro Pulse Lidar System
 Mini Micro Pulse Lidar System MiniMPL-532-C Sensor Suite Operations Manual Version: June 2016 THIS PAGE INTENTIONALLY LEFT BLANK 2 Table of Contents MINIMPL SENSOR SUITE SYSTEM: RECORD OF PURCHASE... 4
USA Price List. January or 8-channel LIBSCAN system (100 mj, 1064 nm laser) Alternative LIBSCAN configurations
 Alternative LIBSCAN configurations") USA Price List January 2012 PRODUCT CODE LIBSCAN 100 LIBSCAN DESCRIPTION 6 or 8-channel LIBSCAN system (100 mj, 1064 nm laser) Includes LIBSCAN head, laser, spectrometer console, interconnecting umbilical
USA Price List January 2012 PRODUCT CODE LIBSCAN 100 LIBSCAN DESCRIPTION 6 or 8-channel LIBSCAN system (100 mj, 1064 nm laser) Includes LIBSCAN head, laser, spectrometer console, interconnecting umbilical
Neutron Spectrometer Operation Manual
 Neutron Spectrometer Operation Manual MIT Department of Physics (Dated: October 16, 2014) This document is for assisting in the understanding and accessing of the technical aspects of the neutron physics
CAEN Tools for Discovery
 Viareggio March 28, 2011 Introduction: what is the SiPM? The Silicon PhotoMultiplier (SiPM) consists of a high density (up to ~10 3 /mm 2 ) matrix of diodes connected in parallel on a common Si substrate.
L5-C LED Fresnel L I G H T I N G - P R O D U C T S P E C I F I C A T I O N V2.2
 L5-C LED Fresnel L I G H T I N G - P R O D U C T S P E C I F I C A T I O N V2.2 A. General 1. The luminaire shall be a RGBW color mixing LED Fresnel luminaire with an electronically controlled LED light
User Guide. Automated Xenon Entertainment Lighting System
 User Guide Automated Xenon Entertainment Lighting System The Syncrolite System The Syncrolite Automated Xenon Entertainment lighting system is designed for years of trouble free service when properly operated
SPECIAL SPECIFICATION 1291 Fiber Optic Video Data Transmission Equipment
 1993 Specifications CSJ 0500-01-117 SPECIAL SPECIFICATION 1291 Fiber Optic Video Data Transmission Equipment 1. Description. This Item shall govern for the furnishing and installation of Fiber Optic Video
Getting Started with the LabVIEW Sound and Vibration Toolkit
 1 Getting Started with the LabVIEW Sound and Vibration Toolkit This tutorial is designed to introduce you to some of the sound and vibration analysis capabilities in the industry-leading software tool
2178 Fiber Optic Splice Case and 2181 Cable Addition Kit
 2178 Fiber Optic Splice Case and 2181 Cable Addition Kit Instructions January 1994 Issue 1, 34-7029-6387-6 1 2 Contents: 1.0 General... 4 2.0 Specifications... 4 3.0 Kit Contents... 5 SECTION 1: 2178 Splice
EM1. Transmissive Optical Encoder Module Page 1 of 8. Description. Features
 Description Page 1 of 8 The EM1 is a transmissive optical encoder module. This module is designed to detect rotary or linear position when used together with a codewheel or linear strip. The EM1 consists
TM series. Trigger function included
 Trigger function included The is a polychromator integrated with optical elements, an and a driver circuit. Light to be measured is guided into the entrance port of through an optical fiber and the spectrum
EMS DATA ACQUISITION AND MANAGEMENT (LVDAM-EMS) MODEL 9062-C
 MODEL 9062-C") A Electric Power / Controls 2 kw EMS DATA ACQUISITION AND MANAGEMENT (LVDAM-EMS) MODEL 9062-C GENERAL DESCRIPTION The Lab-Volt Data Acquisition and Management for Electromechanical Systems (LVDAM-EMS),
A Electric Power / Controls 2 kw EMS DATA ACQUISITION AND MANAGEMENT (LVDAM-EMS) MODEL 9062-C GENERAL DESCRIPTION The Lab-Volt Data Acquisition and Management for Electromechanical Systems (LVDAM-EMS),